10 Best MySQL Reporting Tools
Working with MySQL databases can generate valuable insights, but choosing the right reporting tool can make all the difference in how easily and efficiently you access that data. With a wide range of MySQL reporting tools available, it can be challenging to know which one best fits your needs.
To help you understand your options, we’ve compiled a list of the 10 best MySQL reporting tools, highlighting their standout features, pricing, and ease of use.
Whether you're a small business looking for simplicity or an enterprise needing advanced reporting capabilities, there’s a tool here for everyone. Let’s take a closer look at the top solutions.
List of the Top 10 MySQL Reporting Tools
1. BlazeSQL
2. Tableau
3. Microsoft Power BI
4. Metabase
5. Coefficient
6. Knowi
7. Domo
8. Looker
9. Zoho Analytics
10. Devart
1. BlazeSQL
BlazeSQL is an easy-to-use tool that connects with MySQL to transform your data into visual insights using AI, simplifying and speeding up data analysis. It’s an ideal tool for teams in marketing, sales, and operations who need quick, data-driven insights without relying on technical skills. By interacting with BlazeSQL's AI chatbot, users can effortlessly generate charts and dashboards through simple queries. Its user-friendly interface and AI-driven features make it a valuable asset for MySQL users looking to enhance their reporting and decision-making processes.
Key Features
1. Data Visualization
BlazeSQL is designed to work with MySQL, enabling users to visualize data through an AI chatbot that retrieves and displays insights. This makes it easier for users to understand and analyze their MySQL data without needing technical skills.
2. AI-Analytics Assistant
BlazeSQL acts as your personal AI analytics assistant and chatbot, allowing users to input natural language queries, generate MySQL queries, and handle data analysis. This makes data insights faster and more accessible to both technical and non-technical users. It reduces the time spent on manual queries and allows users to gain insights from MySQL data effortlessly.
3. Data Security
BlazeSQL ensures top-level data security by adhering to strict encryption protocols and secure access controls. Your data remains protected throughout the entire analysis process, safeguarding both storage and retrieval.
4. AI-Generated Weekly Reports
BlazeSQL simplifies weekly changes in reporting with AI-driven automation, reducing the time and effort required to generate detailed reports from SQL data.
5. Team Collaboration
This feature allows multiple team members to easily share, access, and collaborate on data insights. Teams can generate and review reports, share AI-driven SQL queries, and visualize MySQL data together.
Pros of BlazeSQL
User-Friendly interface
Supports multiple SQL databases, including MySQL, Snowflake, and PostgreSQL.
Efficient data analysis
Cons of BlazeSQL
A paid subscription is required for continued use after the trial period.
BlazeSQL Pricing
Blaze Pro: $39/month
Blaze Advanced: $99/month
Blaze Team: Starting at $149/month
Blaze Team Advanced: Starting at $499/month (includes 3 users, $75 per extra user)
Blaze Enterprise: Custom pricing is available
Final Verdict on BlazeSQL
BlazeSQL is an excellent choice for MySQL users seeking to make data analysis more efficient and accessible. Its AI capabilities simplify complex tasks, allowing users to generate reports and visuals from MySQL data without needing technical expertise. The platform’s automation features and intuitive interface help increase productivity by reducing manual effort and delivering real-time insights.
Start using BlazeSQL with MySQL today to simplify your data reporting and optimize your decision-making process!
2. Tableau

Tableau is known for its top-notch data visualization tools, making it a popular choice for businesses. It supports MySQL, allowing users to connect and pull data easily. With Tableau, you can build custom SQL queries, giving you control over the specific data you want to work with. Once connected, you can create interactive dashboards, charts, and reports without much hassle. Its drag-and-drop interface makes data visualization straightforward, even for complex datasets.
Key Features
1. Custom SQL Queries
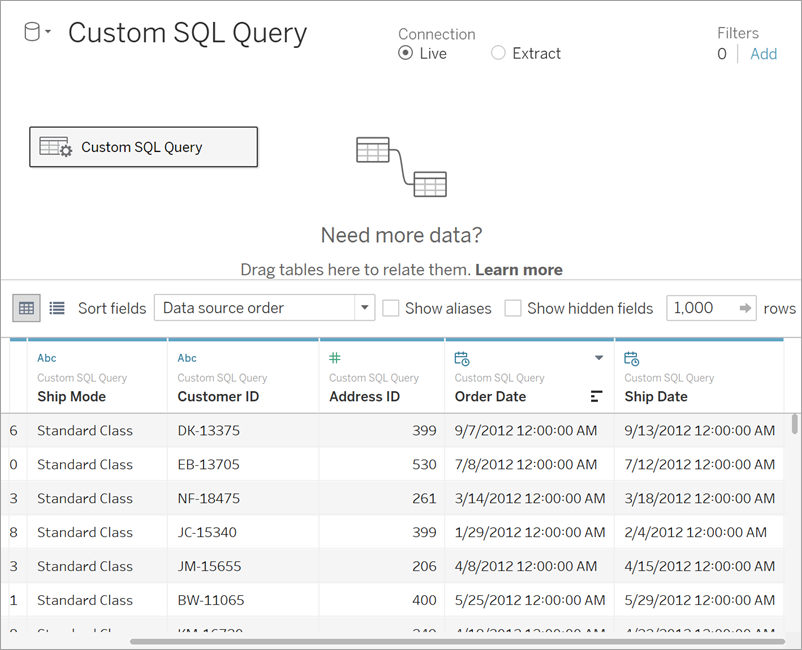
Tableau allows users to write custom SQL queries. This helps them extract exactly the data they need from various databases.
2. Custom SQL Connection
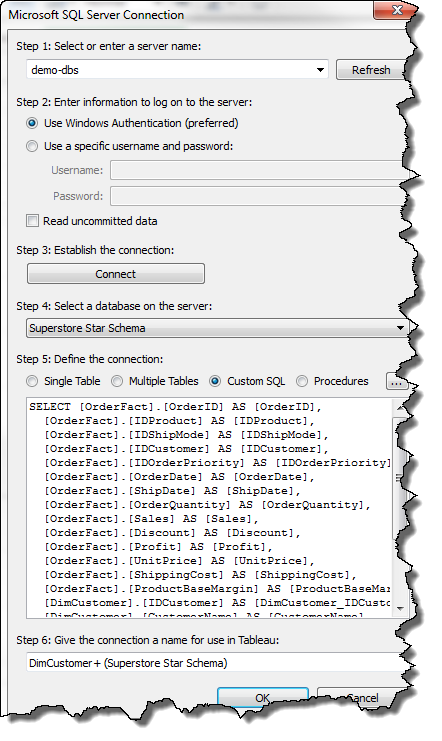
Tableau's custom SQL connection enables users to pull specific datasets from databases like MySQL for precise analysis and reporting.
3. Interactive Dashboards
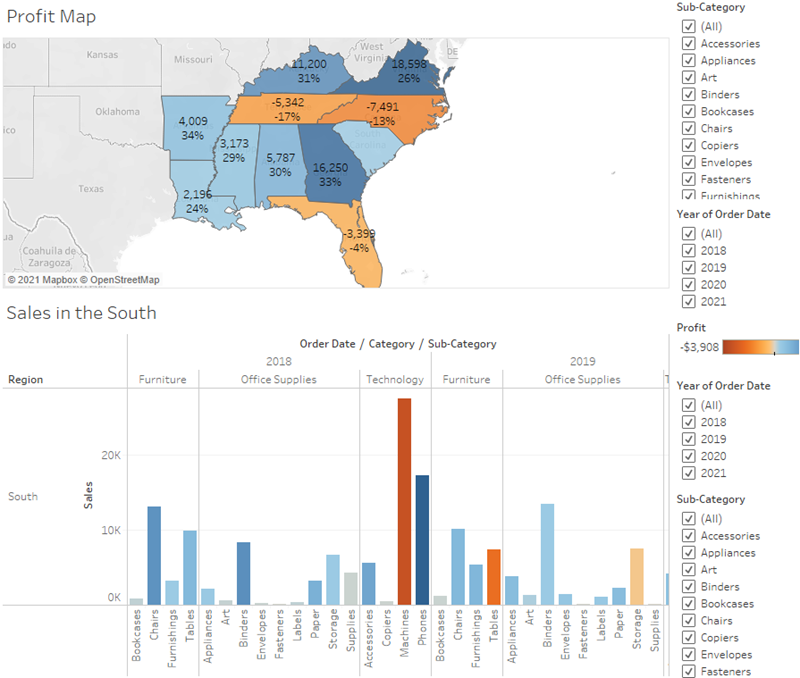
Users can create live dashboards that update in real time, making tracking key metrics and trends easier without refreshing or manually updating.
4. Data Blending
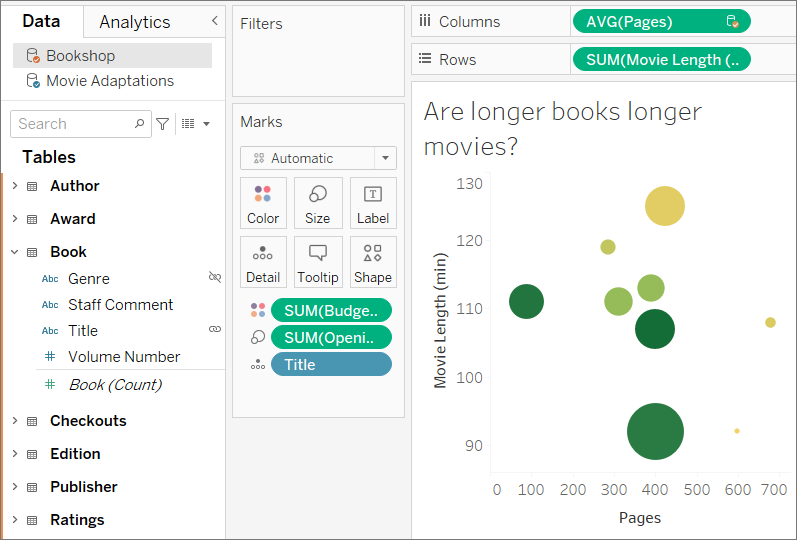
Experience a more detailed analysis and reporting by integrating diverse datasets without complex data preparation in Tableau.
Pros of Tableau
Extensive customer resources
Broad database connectivity
Interactive dashboards
Collaboration features
Cons of Tableau
Steep learning curve
Expensive for small teams
Requires technical knowledge
Tableau Pricing
Tableau Enterprise Creator: $115 /user/month
Tableau Enterprise Explorer: $70/user/month
Tableau Enterprise Viewer: $35/user/month
Final Verdict on Tableau
Tableau is the go-to reporting tool for teams. It helps you prioritize data visualization and supports different databases. It requires some technical knowledge to make full use of its features. However, Tableau is worth the investment if you need advanced visuals and custom SQL queries.
3. Microsoft Power BI

Microsoft Power BI is an excellent SQL reporting tool that integrates well with other Microsoft services. With this connector, you can import data directly from your MySQL server into Microsoft tools like Excel and Power BI. After entering your server details and login credentials, Power Query gives you options to filter, transform, and shape the data before loading it into your report. It also supports custom SQL queries if you need more control over what data is retrieved.
Key Features
1. SQL Query Support
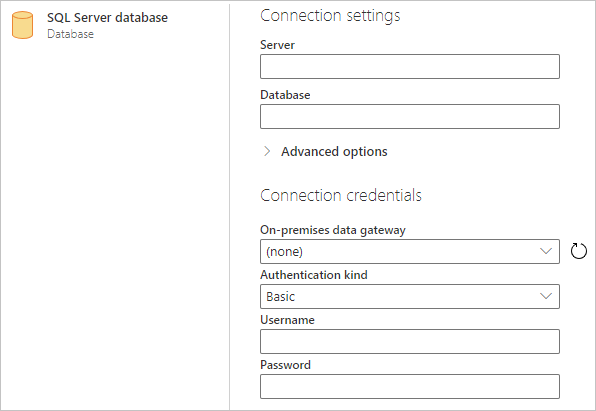
This feature allows users to connect directly to SQL Server and run custom SQL queries to retrieve specific data for reporting. It gives you full control and gives a detailed analysis of your SQL databases.
2. Real-Time Reporting
The live reporting feature allows easy integration with MySQL so that users can stream live data directly into their reports and dashboards. It provides instant updates on key metrics and enables timely decision-making without waiting for scheduled data refreshes.
3. Custom Dashboards
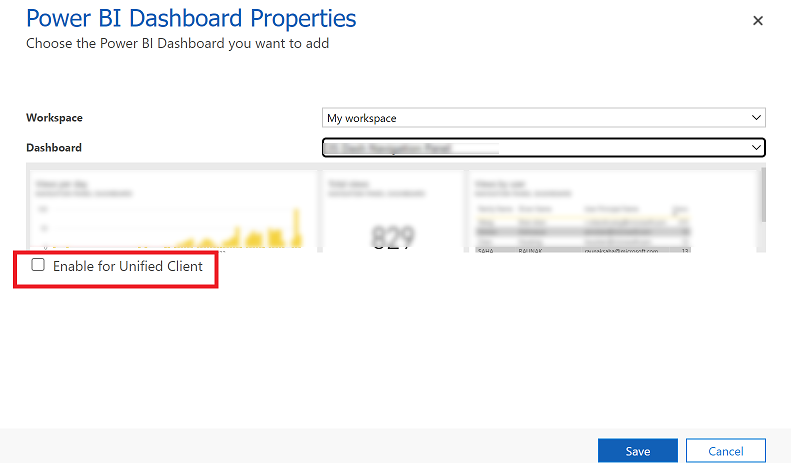
Users can create custom dashboards tailored to their specific reporting needs, pulling data from various SQL sources and visualizing them in real time.
4. Interactive Visualizations
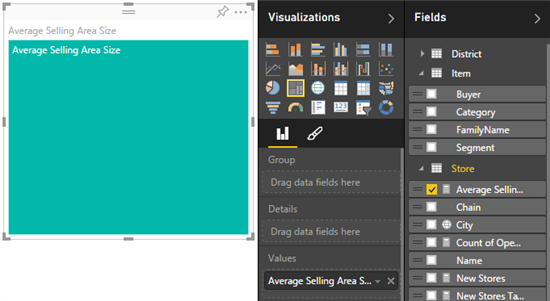
4. Integration with Microsoft Services
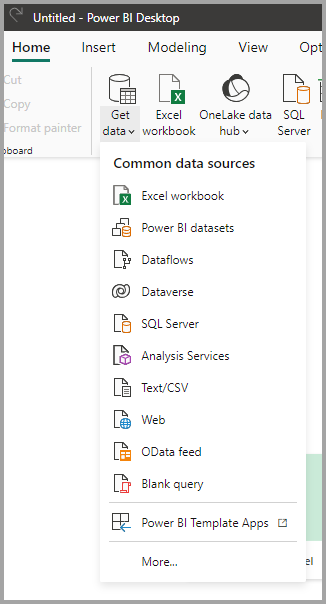
As part of the Microsoft ecosystem, Power BI easily integrates with Excel, Azure, SharePoint, and other Microsoft services, making it easier to combine and analyze data from various sources.
5. Advanced Analytics & AI
This feature allows users to apply machine learning models and advanced data analysis directly to MySQL data. This improves the capability of MySQL reporting by uncovering trends and generating forecasts from real-time data.
Pros of Power BI
Easy to use
Integrates with Microsoft services
Custom dashboards
Cons of Power BI
Limited responsiveness
Performance issues
Online only functionality
Power BI Pricing
Free account
Power BI Pro: $10/user/month
Power BI Premium: $20/user/month
Power BI embedded: custom pricing
Final Verdict on Power BI
Power BI is a strong contender for MySQL reporting, especially for those who already use Microsoft tools. Its real-time analytics and low pricing make it a great choice for businesses of any size, but it may not offer as much flexibility for users who need advanced customizations.
4. Metabase

Metabase is an open-source SQL reporting tool designed to make data analysis accessible for everyone. Metabase is ideal for teams looking for a simple yet powerful tool to generate reports, visualize data, and collaborate on real-time insights. It supports basic queries and more complex custom SQL queries for advanced users. Metabase’s user-friendly interface allows you to explore your MySQL data with just a few clicks, making it accessible to non-technical users.
Key Features
1. SQL Editor

Metabase features a built-in SQL editor that allows users to write their own queries for more complex reporting needs. This gives more control to users who require precise data analysis.
2. Interactive Dashboards
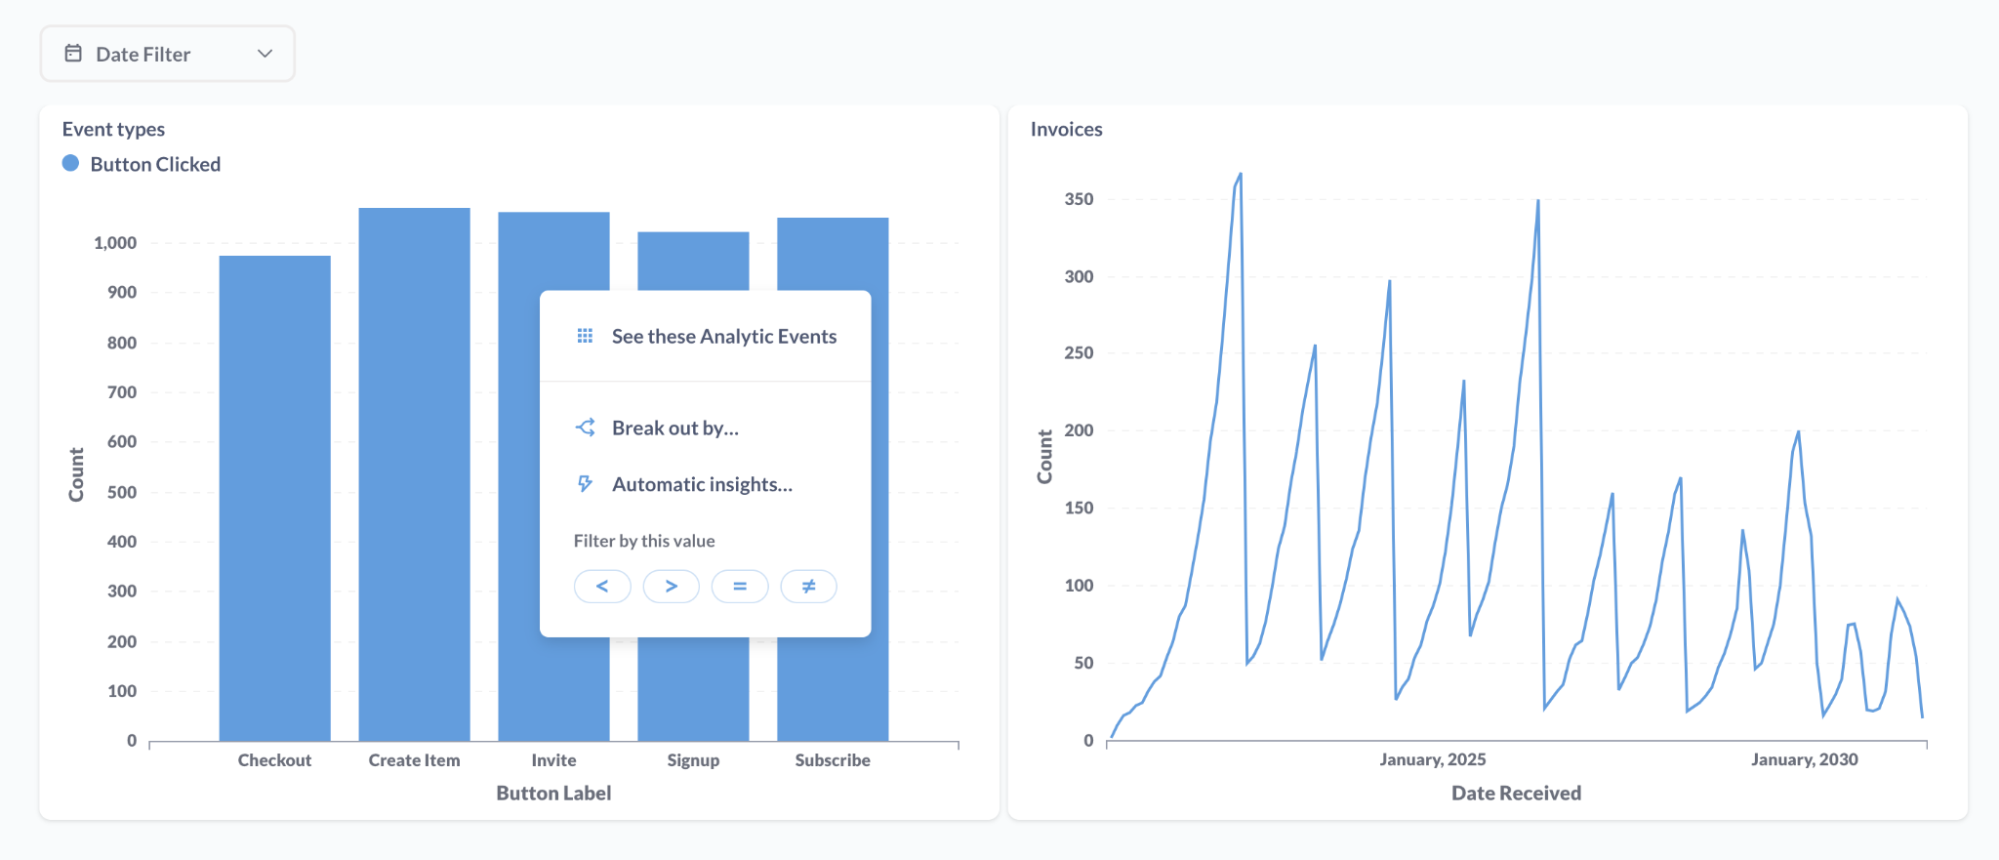
Metabase offers simple yet effective dashboards where users can visually explore their data. It provides an intuitive drag-and-drop interface to create reports and update filters.
3. Customer-Facing Analytics
This feature allows businesses to embed Metabase dashboards into their apps or websites, providing customer-facing analytics without developing custom solutions.
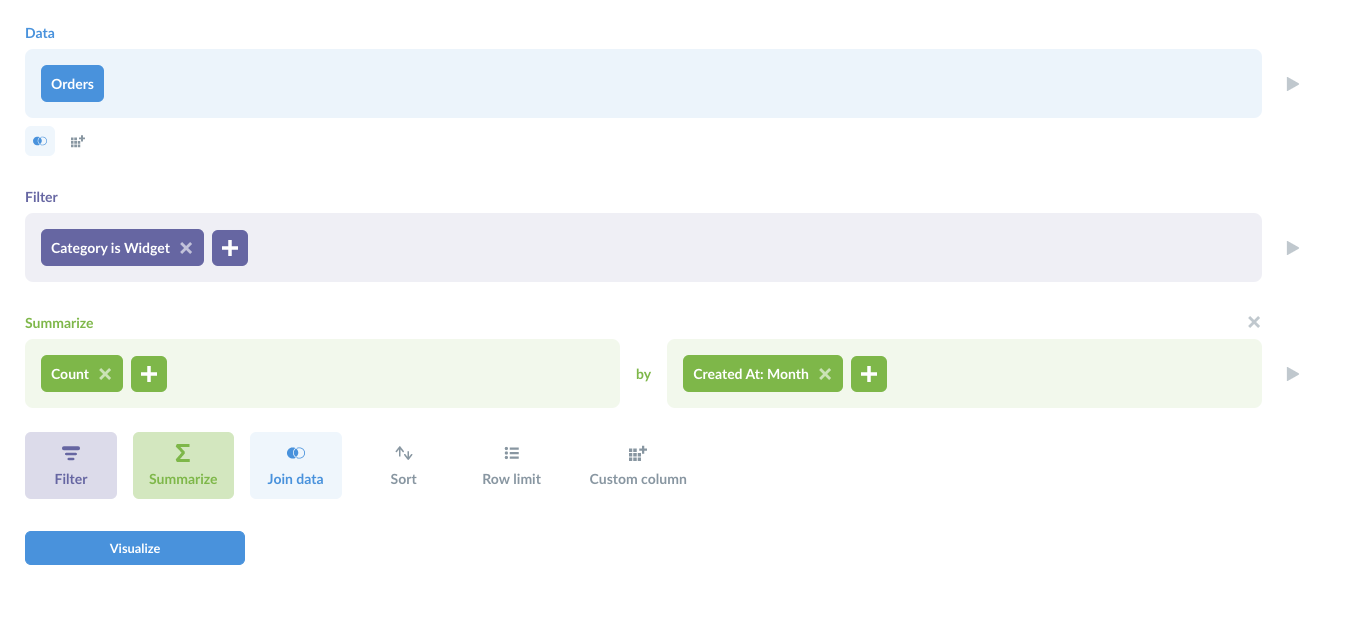
4. Simple Query Builder
Metabase’s query builder feature allows users to create SQL queries without writing code, making data analysis accessible to non-technical users. With a drag-and-drop interface, users can easily query MySQL databases to generate reports.
5. Data Visualization
Transform raw SQL data from databases like MySQL into easy-to-understand charts, graphs, and dashboards. With its intuitive drag-and-drop interface, users can create interactive visualizations that provide deeper insights into their data.
Pros of Metabase
Open-source flexibility
Easy to use
Customizable
Cons of Metabase
Slow processing times
Limited support options
Lacks advanced features
Metabase Pricing
Starter Plan: $85/month, includes 5 users, additional $5 per user/month
Pro Plan: $500/month, includes 10 users, additional $10 per user/month
Enterprise: Starts at $15,000/year (custom pricing)
Final Verdict on Metabase
Metabase is ideal for developers and teams who prefer open-source tools with flexibility. It’s highly customizable but lacks advanced features when compared to other tools. The ability to quickly generate reports and share dashboards makes it ideal for collaboration. Metabase is an option to consider if you need a straightforward, easy-to-use platform for MySQL data analysis.
5. Coefficient

Another reporting tool, Coefficient, integrates MySQL directly into Google Sheets, allowing users to run SQL queries and generate reports within a familiar spreadsheet environment. After setting up the connection with your server credentials, you can refresh your data automatically, ensuring you’re always working with the most up-to-date information. The platform also supports custom SQL queries, giving you control over which data is pulled. This is particularly useful for those who need to filter or sort data before bringing it into Google Sheets.
Key Features
1. Google Sheets Integration
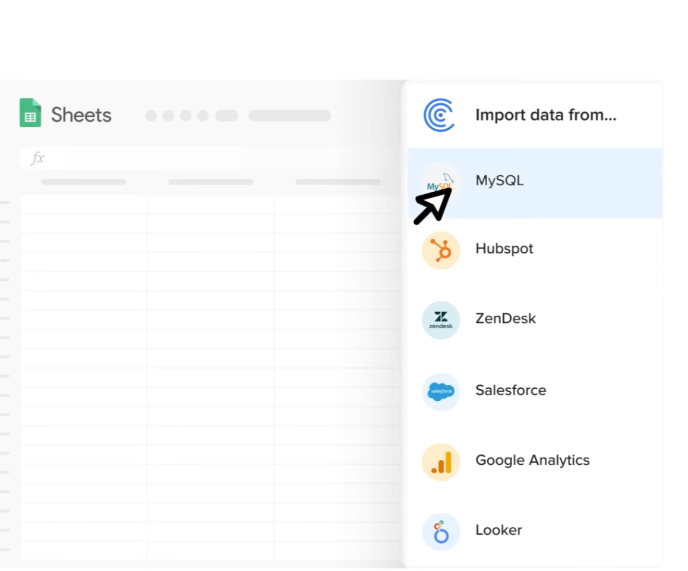
Coefficient directly integrates MySQL and other databases into Google Sheets. It allows users to run SQL queries and build reports within Google Sheets while also being able to share data and collaborate with team members.
2. Automated Data Sync
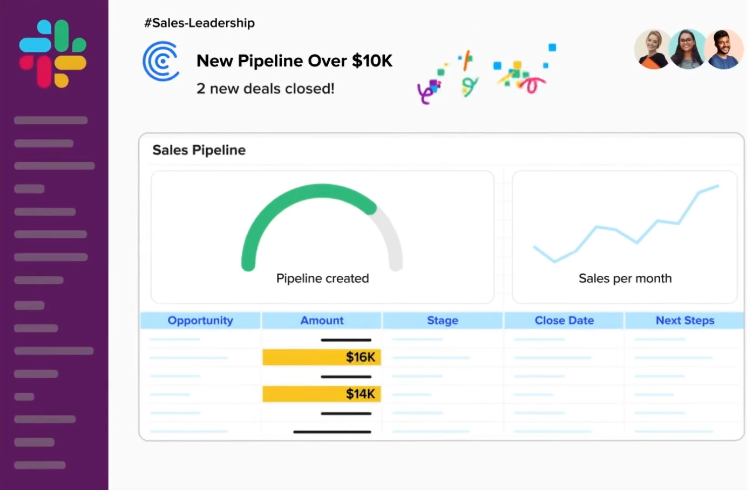
Coefficient syncs data automatically from SQL databases, ensuring that users always have the latest information for analysis without needing manual updates.
3. Business Analytics
Coefficient offers comprehensive business analytics tools that allow users to run SQL queries and perform in-depth analysis of their data.
4. Custom Dashboards
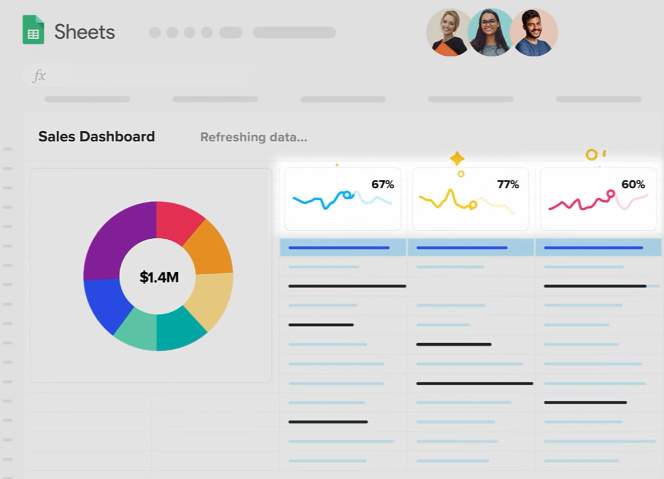
Users can create custom dashboards that automatically update with the latest data from their connected databases, providing real-time insights.
5. Pivot Table Builder
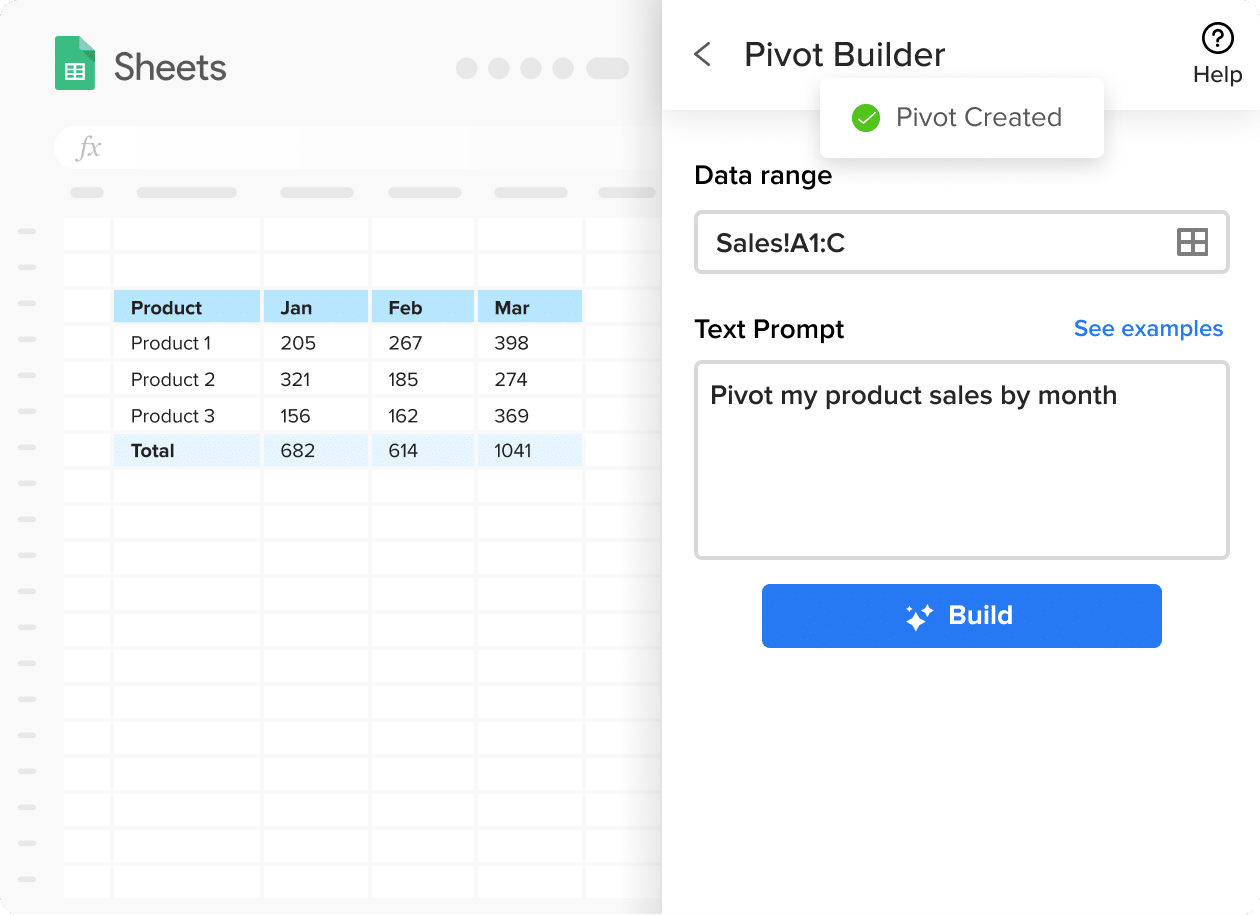
Coefficient's pivot table feature within Google Sheets allows you to summarize and analyze large datasets from MySQL databases. By creating dynamic pivot tables, you can organize data into meaningful insights without manual effort.
6. Data Filtering
With Coefficient, you can filter MySQL data when importing it into Google Sheets. This feature ensures that only relevant information is included in reports. It makes the reporting process smooth and improves data accuracy.
Pros of Coefficient
Simple integration with Google Sheets
Automated data sync
Multiple import options
Easy to use
Cons of Coefficient
Limited advanced reporting features
Lacks in-depth customization
Lagging issues
Coefficient Pricing
Free Plan
Starter: $49/month
Pro: $99/month
Enterprise: Contact team
Final Verdict on Coefficient
Coefficient is great for businesses that rely on Google Sheets for reporting. It simplifies SQL reporting within a familiar interface, though it may lack the depth of standalone SQL tools.
While it may lack advanced customization options found in other SQL reporting tools, Coefficient’s simplicity and accessibility make it a helpful tool. It streamlines your SQL reporting within a familiar spreadsheet environment.
6. Knowi

Knowi offers MySQL and NoSQL reporting tools, combining traditional SQL databases with newer NoSQL data sources to create a powerful reporting platform. It allows businesses to create real-time dashboards, perform natural language queries, and embed analytics into their applications. It is especially suited for organizations with mixed database environments, providing flexibility for blending and analyzing data across multiple platforms.
Key Features
1. SQL and NoSQL Support
Knowi supports both SQL databases and NoSQL databases, making it ideal for businesses with diverse data environments. This dual support allows businesses to blend and analyze data from both SQL and NoSQL sources within the same platform, making it ideal for companies with diverse data needs.
2. Embedded Analytics
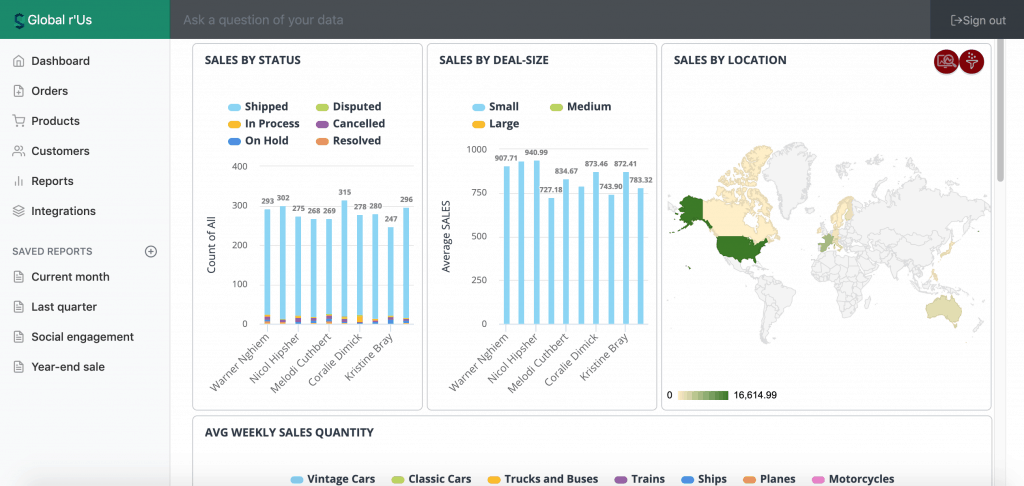
Knowi provides embedded analytics capabilities, allowing users to add real-time data dashboards to their websites or applications for customer use.
3. Search-Based Analytics
Users can perform data searches using natural language, which Knowi converts into SQL or NoSQL queries. This simplifies reporting for non-technical users.
4. Natural Language Processing
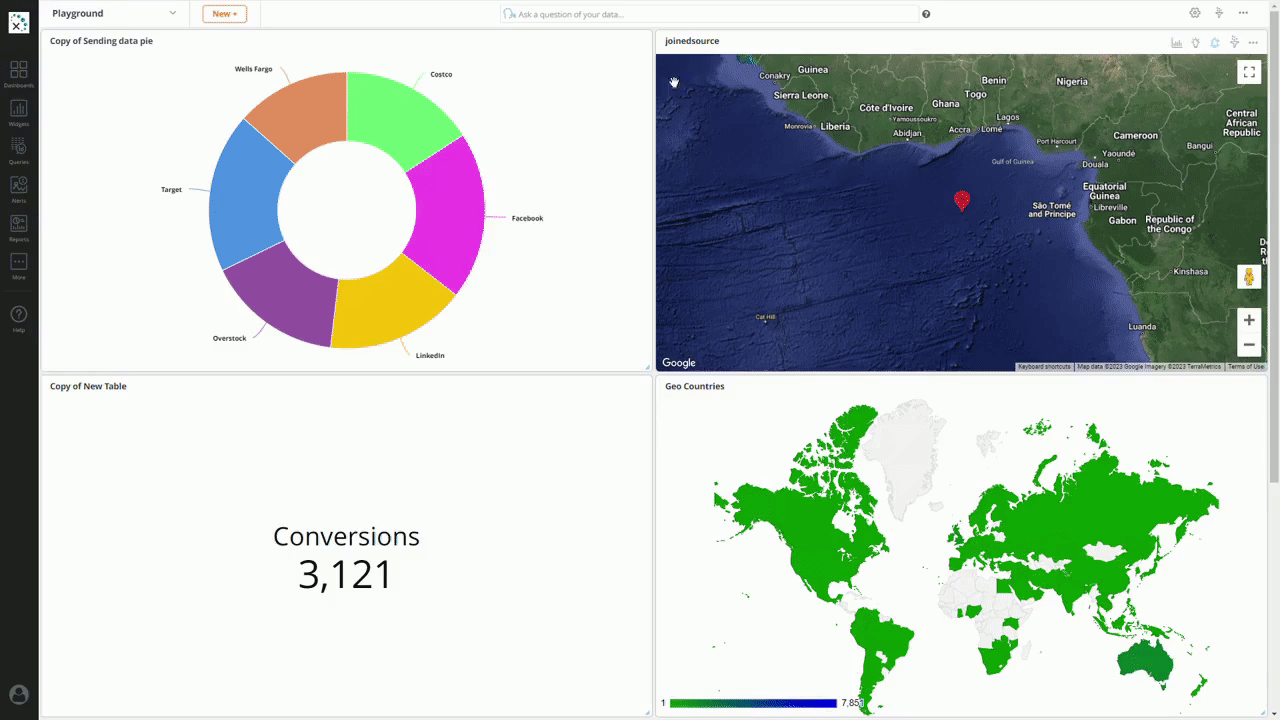
Knowi’s NLP feature makes data analysis accessible to non-technical users, allowing them to retrieve and analyze data without writing complex queries. By converting natural language inputs into actionable queries, Knowi simplifies the reporting process and improves usability for MySQL and other databases.
5. Interactive Dashboards
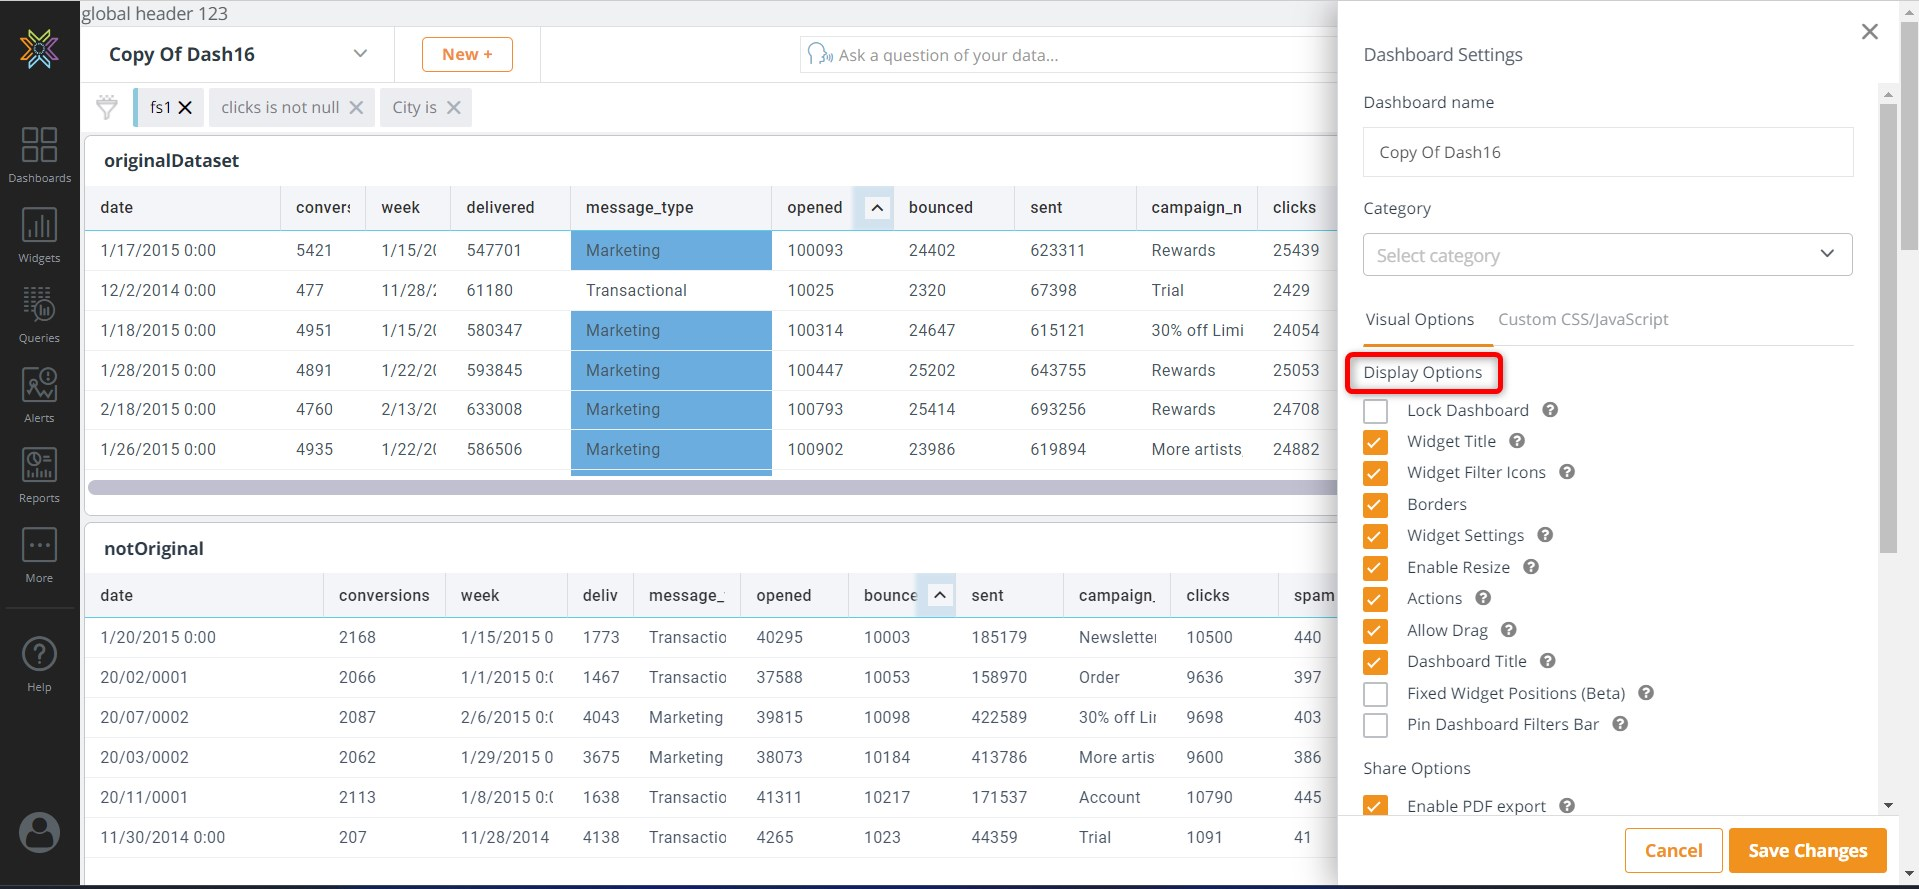
Knowi’s interactive dashboards allow users to customize and filter dashboards, allowing for dynamic data exploration and decision-making. The dashboards automatically update as new data flows in, ensuring up-to-date reporting without manual intervention.
Pros of Knowi
Customer support
Ease of use
Easy integrations
Natural language querying
Cons of Knowi
Higher pricing for advanced features
Limited features compared to other tools
Slow performance
Knowi Pricing
Custom Pricing
Final Verdict on Knowi
Knowi can be used for teams working with both SQL and NoSQL databases. Its support for mixed environments makes it an excellent option for complex reporting needs. While Knowi’s higher pricing may be a drawback for smaller teams, its ability to integrate and analyze data across multiple platforms, coupled with real-time insights, makes it a good reporting tool.
7. Domo

Domo provides a cloud-based MySQL reporting, data visualization, and business intelligence platform. Offering live insights, its custom connectors and interactive dashboards allow businesses to gather insights in a centralized and easy-to-navigate environment. Domo’s scalability and cloud-based flexibility make it ideal for large enterprises that need advanced data analytics and collaboration features.
Key Features
1. SQL Querying
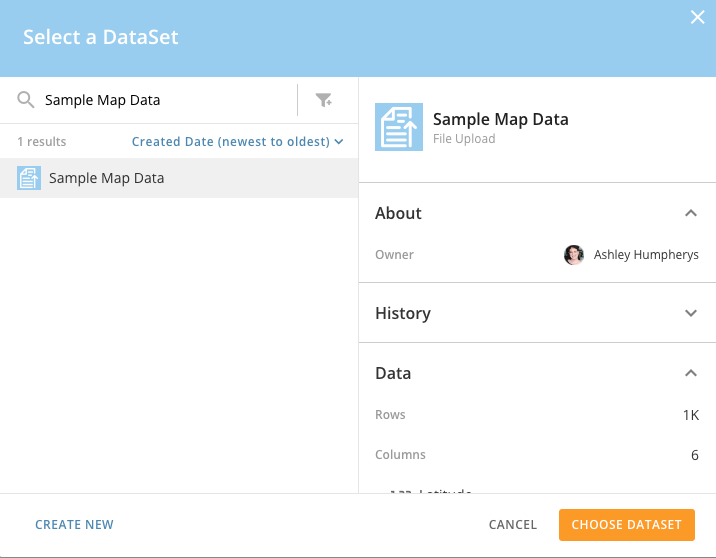
Domo’s SQL queries database feature allows users to directly connect and query databases like MySQL, enabling the extraction of precise data for reporting and analysis. This functionality allows users to write custom SQL queries within Domo to retrieve, transform, and visualize data from multiple sources, optimizing the reporting process.
2. Data Visualization
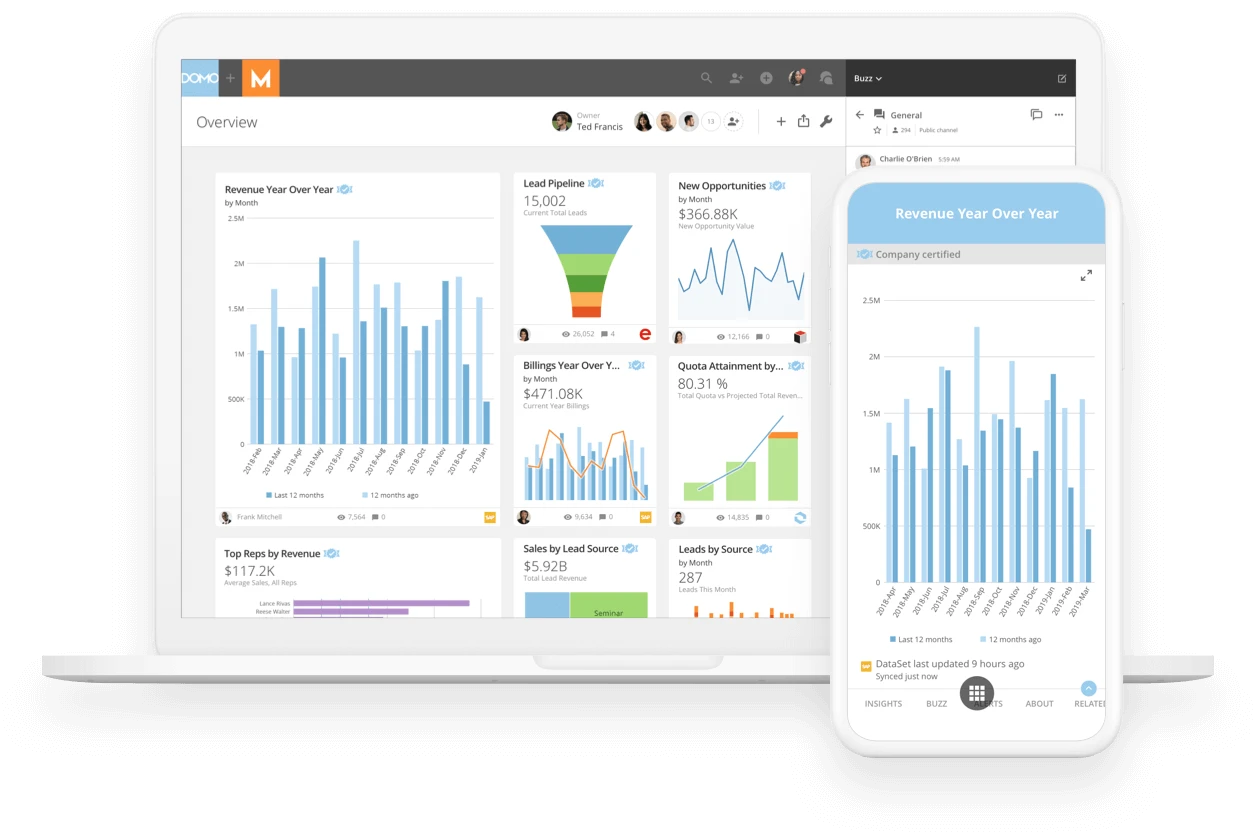
With Domo, users can create interactive charts, graphs, and dashboards, making data insights more accessible to teams across the organization.
3. Data Blending
This feature allows users to combine data from multiple sources, including MySQL, into a unified dataset for deeper analysis. It helps create reports by merging SQL data with other datasets, providing a view of insights for better decision-making.
4. Real-Time Reporting
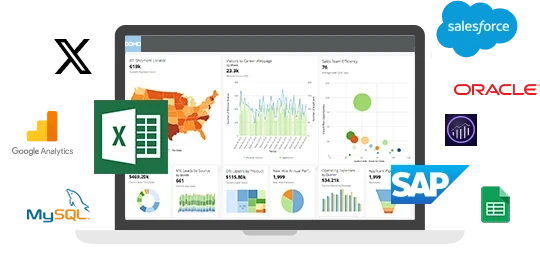
Domo’s real-time reporting allows users to continuously stream and visualize data from MySQL, providing up-to-the-minute insights. Track performance metrics instantly, ensuring timely decision-making based on the most current data available.
5. Advanced Analytics and Machine Learning
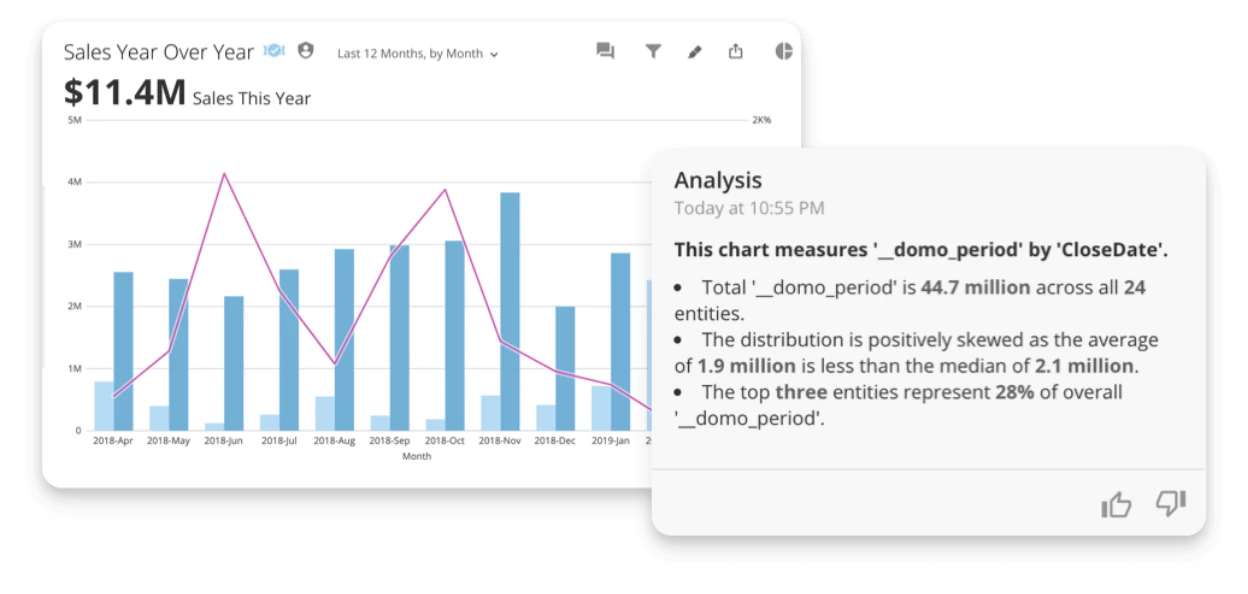
Advanced analytics and machine learning feature allows users to apply predictive analytics and machine learning models directly to their SQL data. With this, businesses can forecast trends, identify patterns, and make data-driven decisions based on real-time insights.
Pros of Domo
Cloud-based platform
Multiple datasets
Custom connectors
Cons of Domo
High cost
Requires technical expertise
Limited integrations
Domo Pricing
Custom pricing based on user needs
Final Verdict on Domo
Domo is best suited for larger enterprises needing scalable, cloud-based reporting. Its best features come at a higher cost, making it less suitable for smaller teams or businesses. With Domo, you can analyze and visualize data, making it easier to gain insights from diverse datasets in a single, integrated view.
8. Looker

Looker, now part of Google Cloud, is a data analytics and reporting tool that integrates with MySQL. It offers deep data analysis and visualization options. It provides businesses with the ability to create rich data visualizations, write custom SQL queries, and embed analytics in their applications. Its smooth integration with Google Cloud makes it a great choice for enterprises looking to build scalable and sophisticated data solutions.
Key Features
1. Custom SQL Queries
Looker allows users to write custom SQL queries to fetch and analyze data from connected databases, offering deep control over data retrieval.
2. Data Visualization
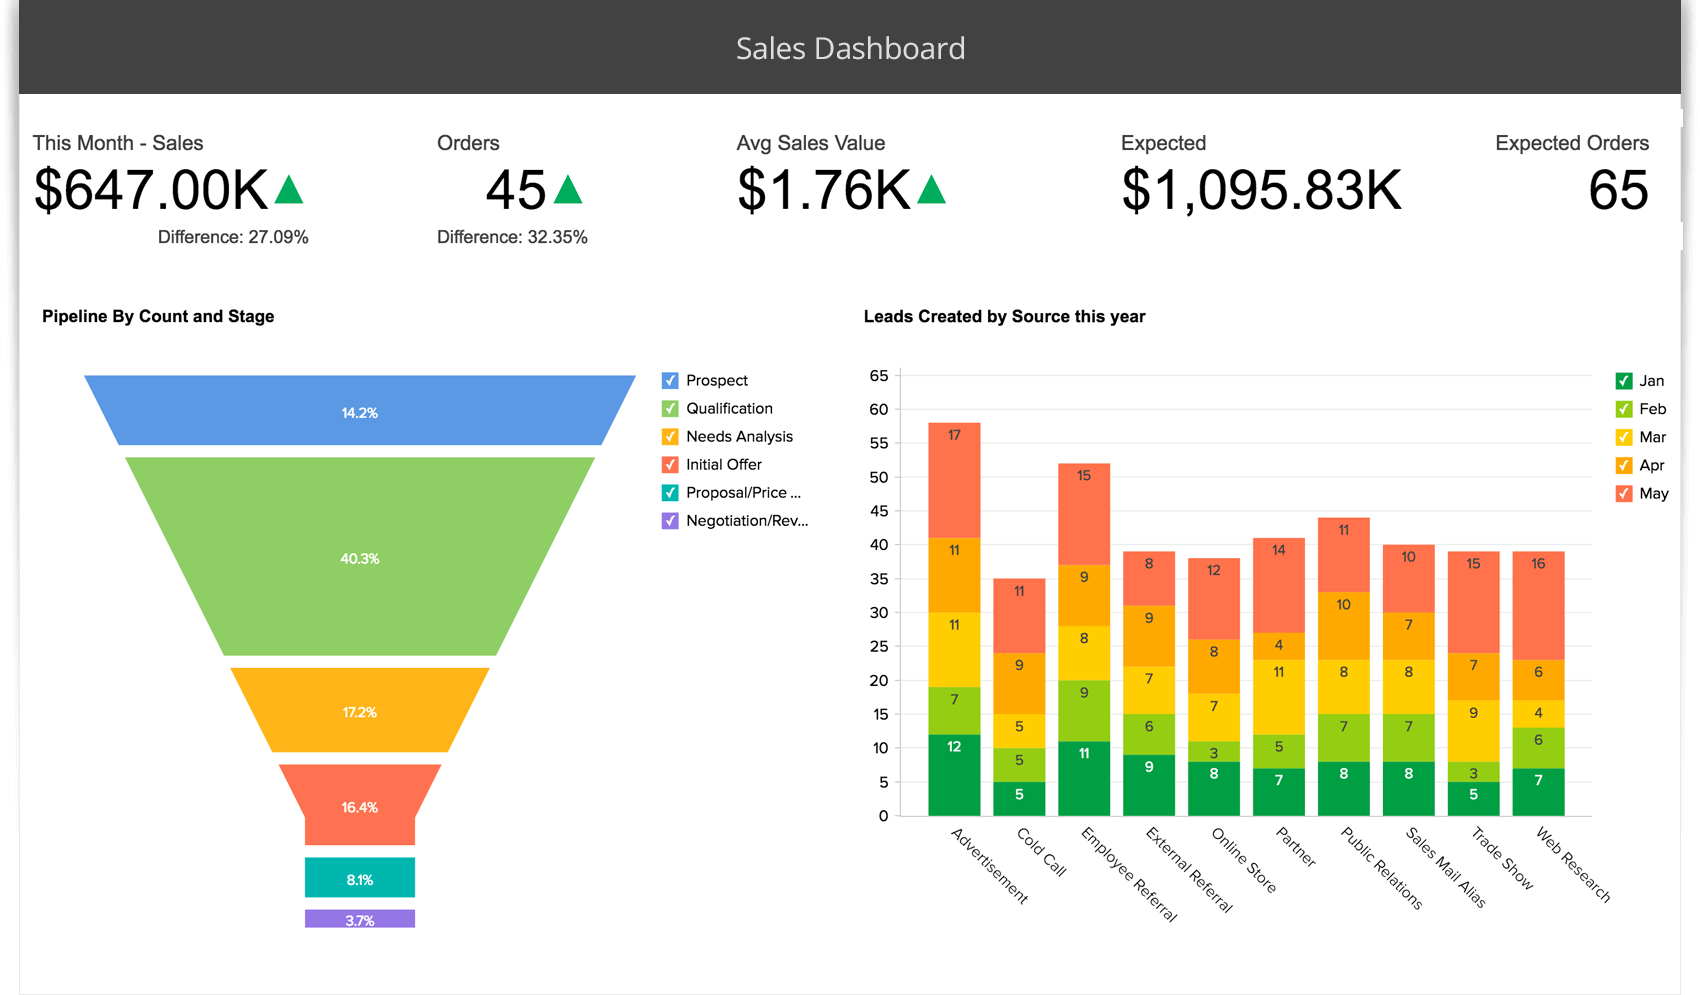
Looker transforms raw SQL data into beautiful charts, graphs, and dashboards, making insights easier to understand and share.
3. Embedded Analytics
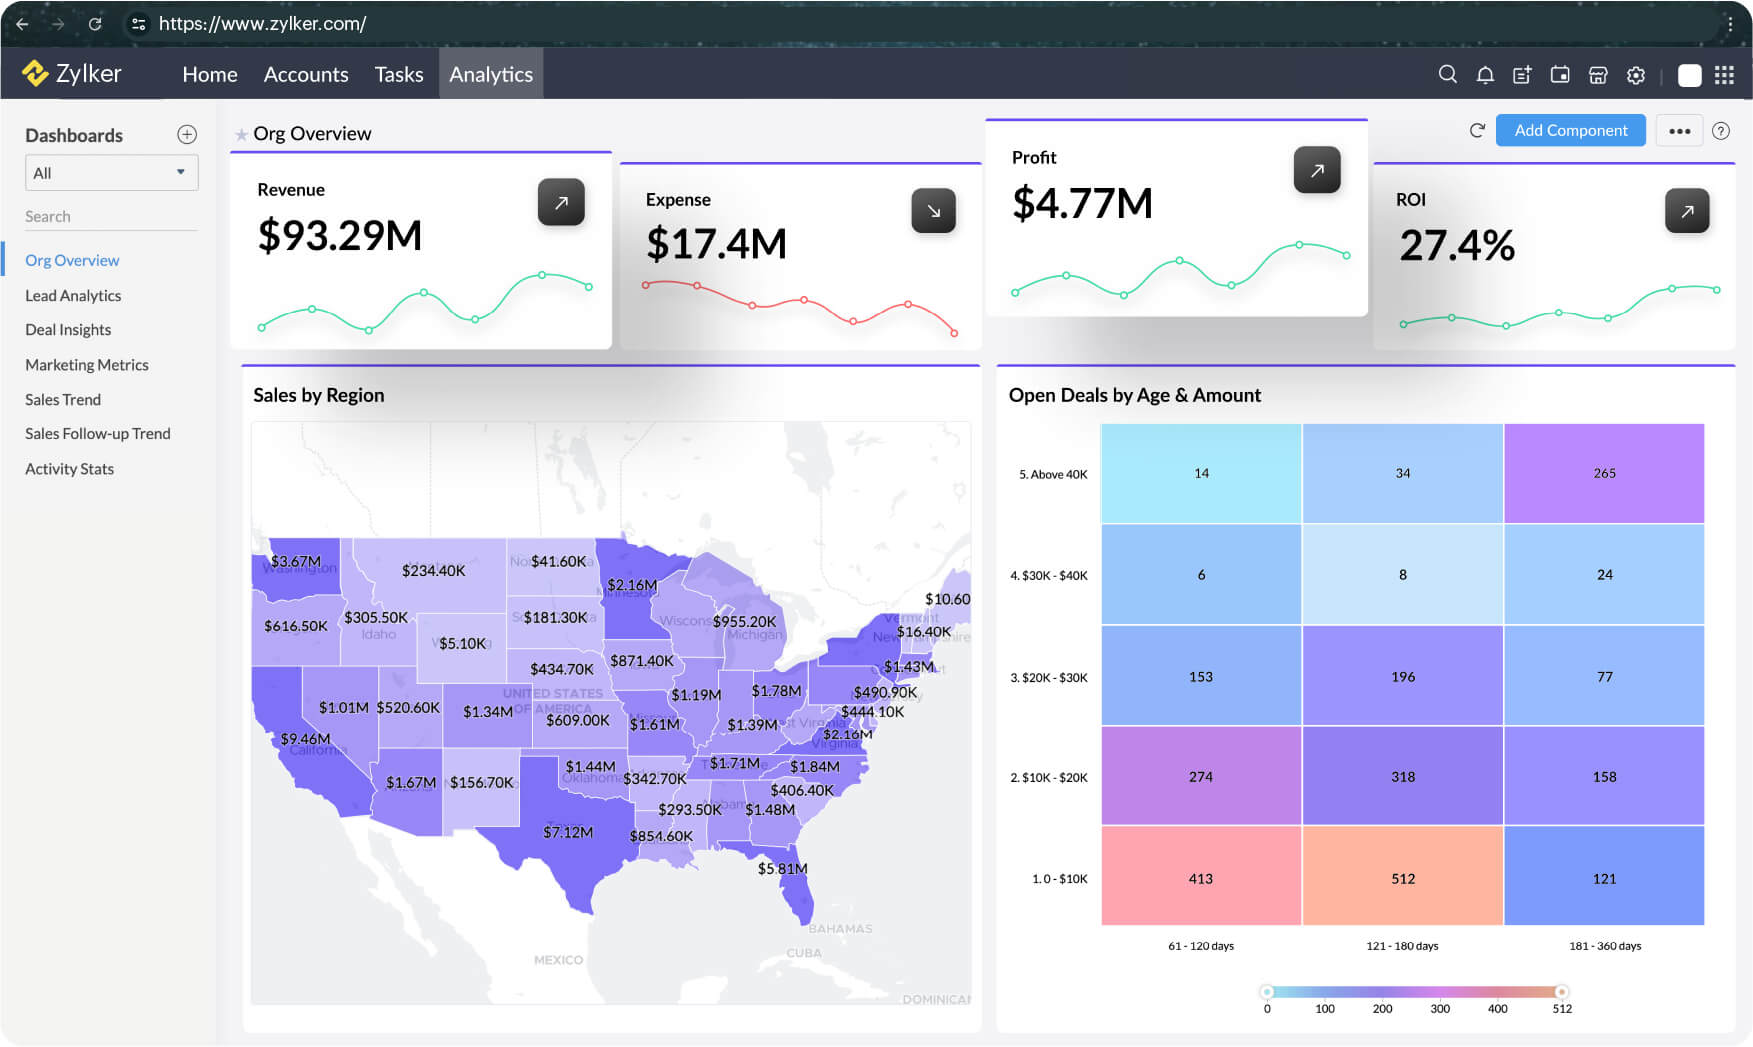
With Looker, businesses can embed analytics and visual reports directly into their websites or applications for customer-facing use.
4. Data Drill Down
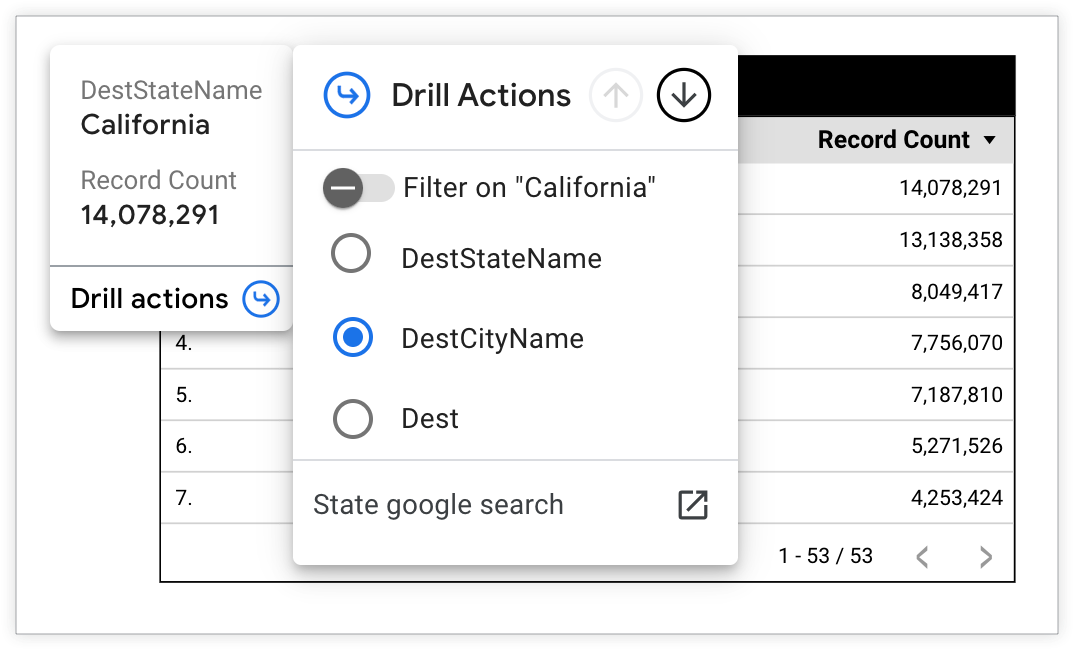
Explore data interactively by clicking through visualizations to reveal deeper insights and specific trends with Looker. By customizing drill paths, you can easily navigate through layers of SQL data, making it easier to analyze underlying factors without creating new reports.
Pros of Looker
Strong data visualization tools
Deep integration with Google Cloud
Easy data comparisons
Cons of Looker
Expensive
Requires technical expertise
Complex for beginners
Looker Pricing
Custom pricing based on requirements
Final Verdict on Looker
Looker is a MySQL reporting tool, particularly for teams already working within the Google Cloud ecosystem. Its advanced features come with a higher learning curve and cost, but it’s worth it for teams needing deep analytics.
9. Zoho Analytics

Zoho Analytics is a cloud-based SQL reporting tool that allows you to easily import data from a local MySQL database. After setting up a connection, you can import tables, views, or custom SQL query results directly into Zoho Analytics. The data import process is straightforward, and you can schedule regular data syncs to keep your reports up-to-date. Once the data is in Zoho Analytics, you can create custom reports, visualizations, and dashboards to analyze and share insights. The platform also allows you to blend data from multiple sources, making it more versatile for complex reporting needs.
Key Features
1. SQL Query Tables
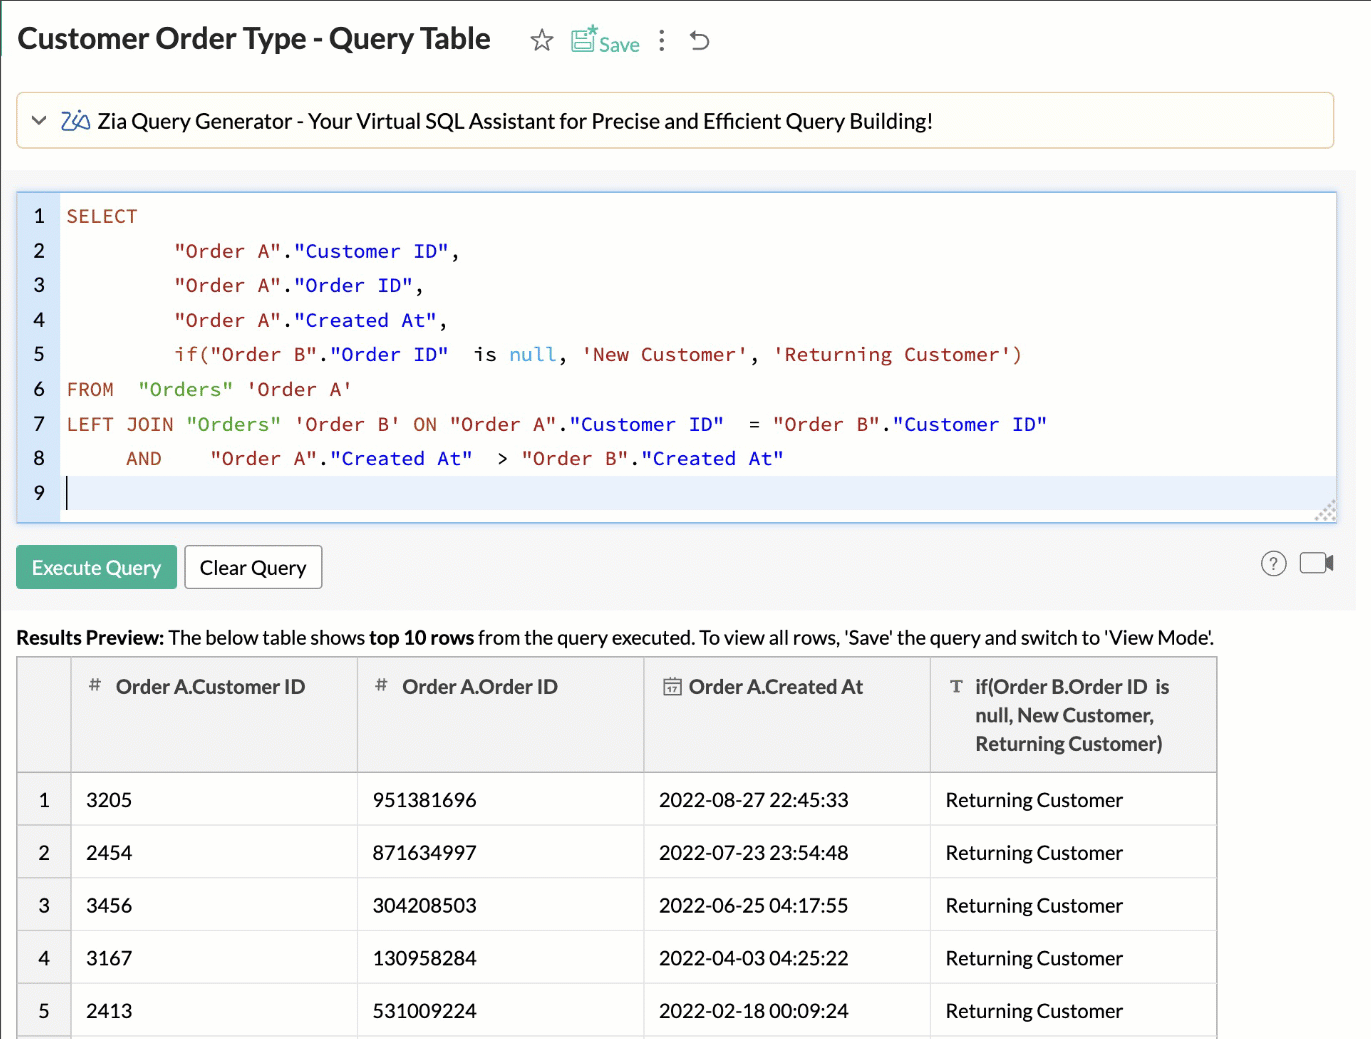
Create custom query tables by writing SQL queries to pull specific data from MySQL and other databases. This enables you to transform and analyze data more effectively by running complex SQL commands, integrating multiple data sources, and generating precise reports.
2. Data Visualization
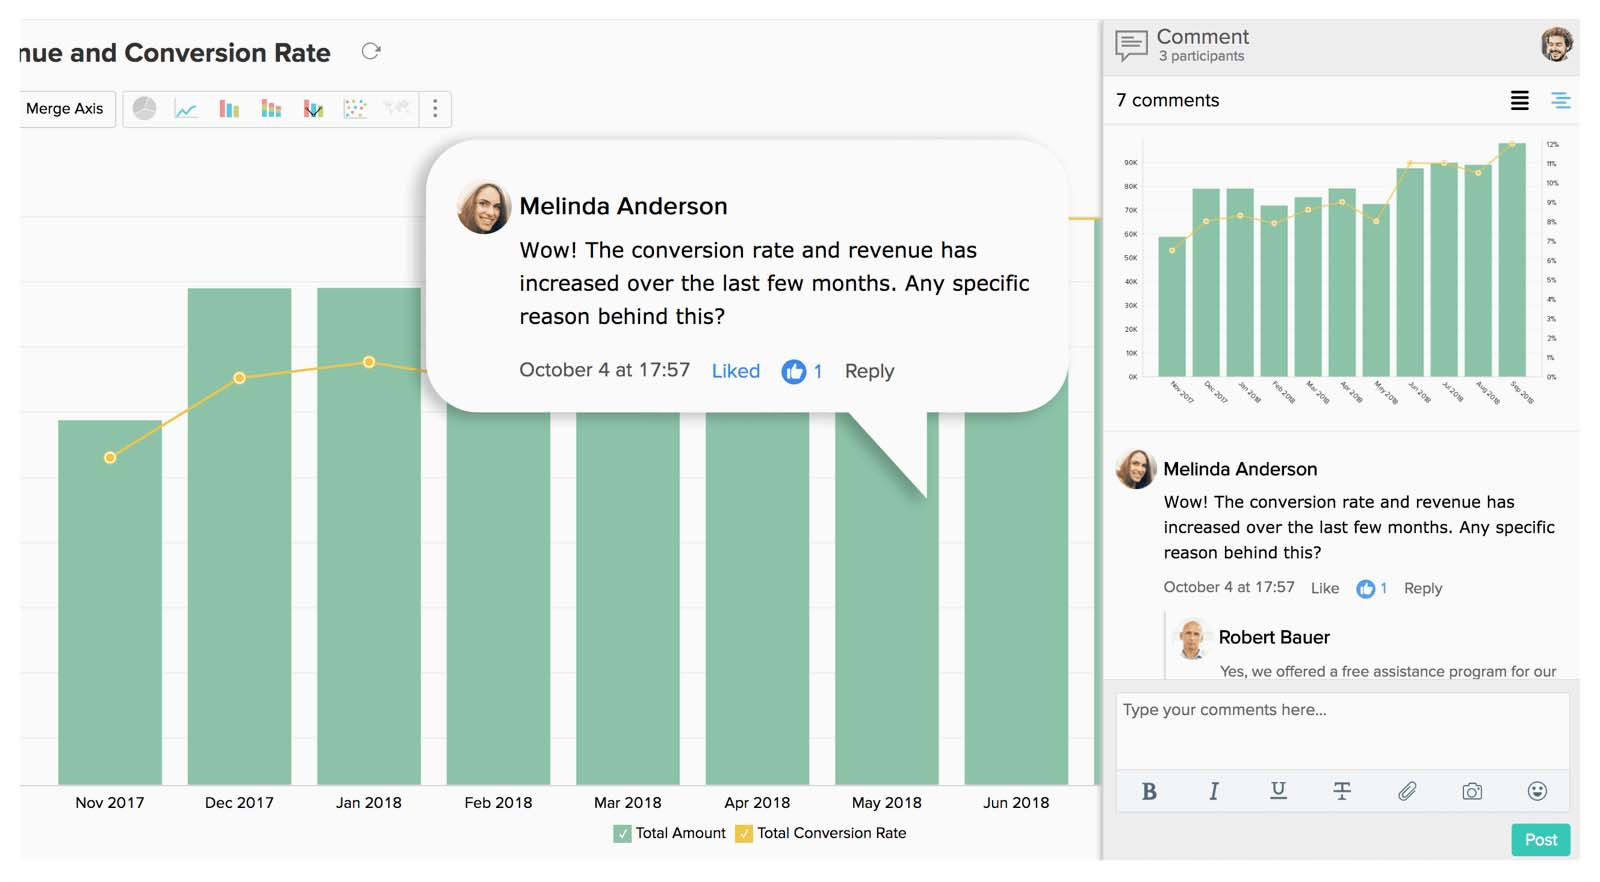
Zoho Analytics provides a drag-and-drop interface for building reports and dashboards, making it easy for users to transform SQL data into actionable insights.
3. Embedded Analytics
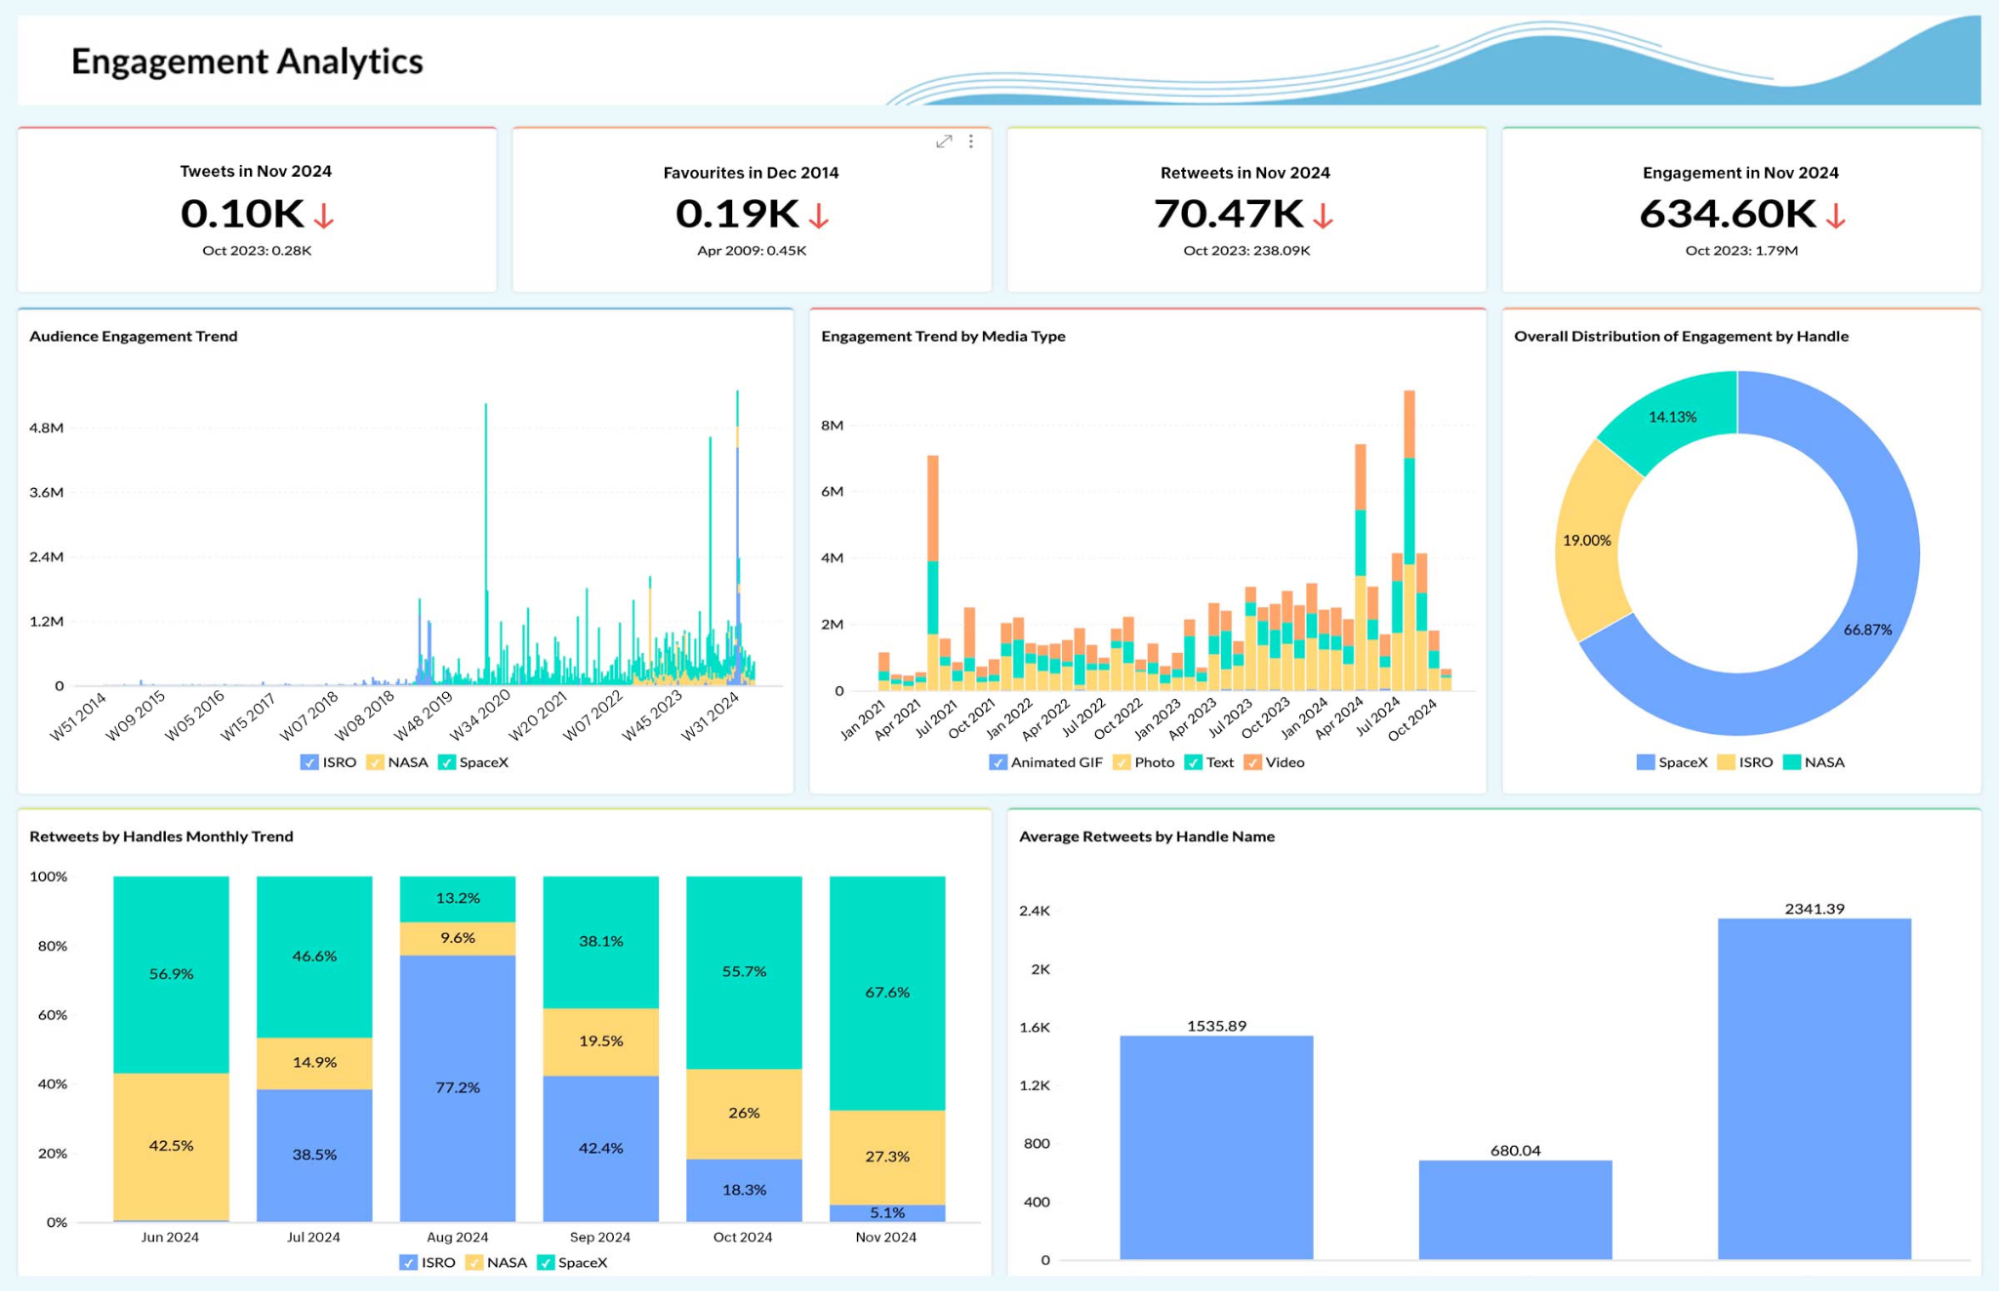
With Zoho, users can embed analytics and reporting dashboards into their websites or applications, making data easily accessible to customers or teams.
4. Cloud BI and Analytics
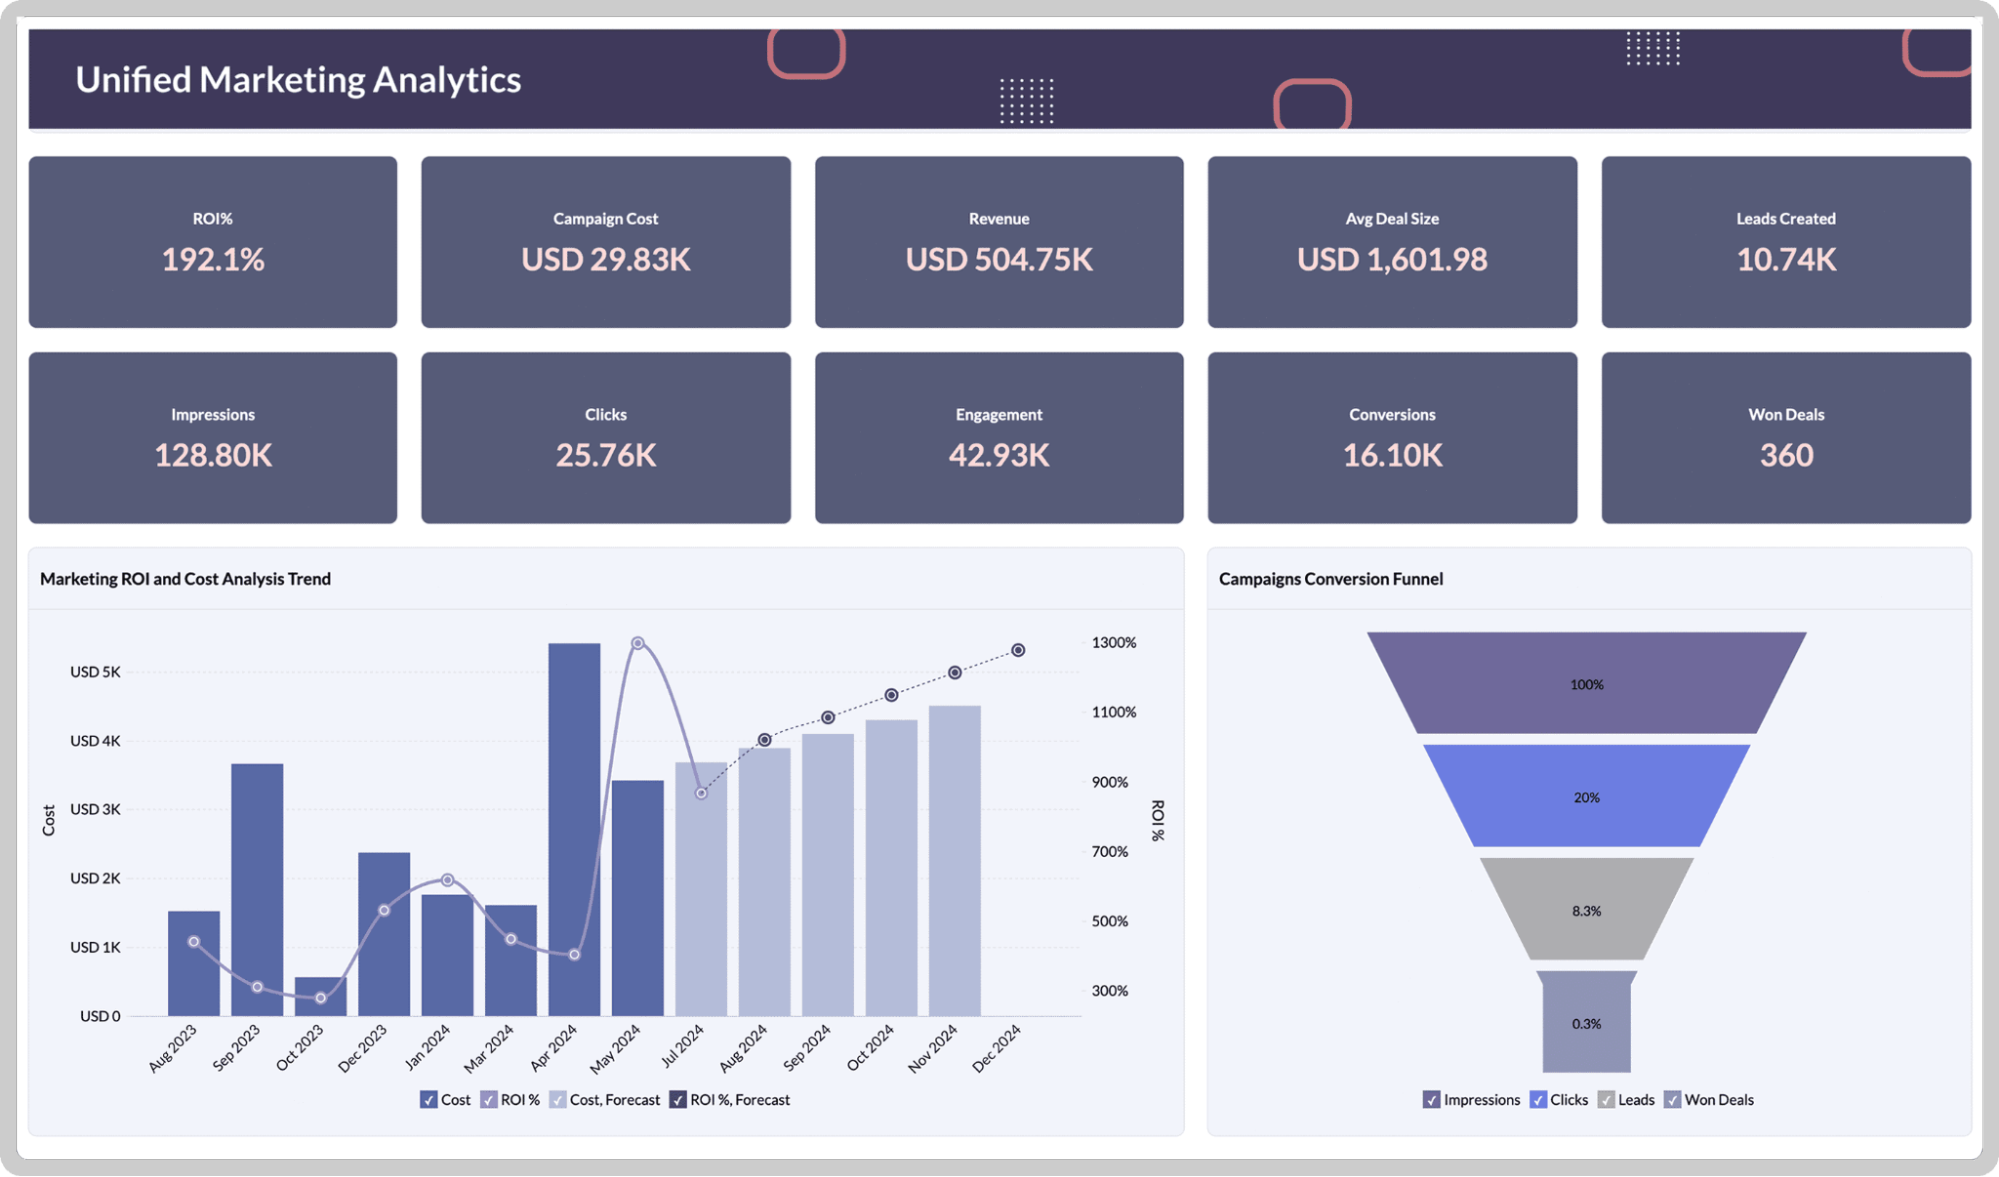
Zoho provides a fully cloud-based platform for creating and managing SQL reports from databases like MySQL. You can easily access, analyze, and share data anytime, anywhere, making collaboration easier while ensuring real-time insights are available across teams.
5. Interactive Dashboards and Reports
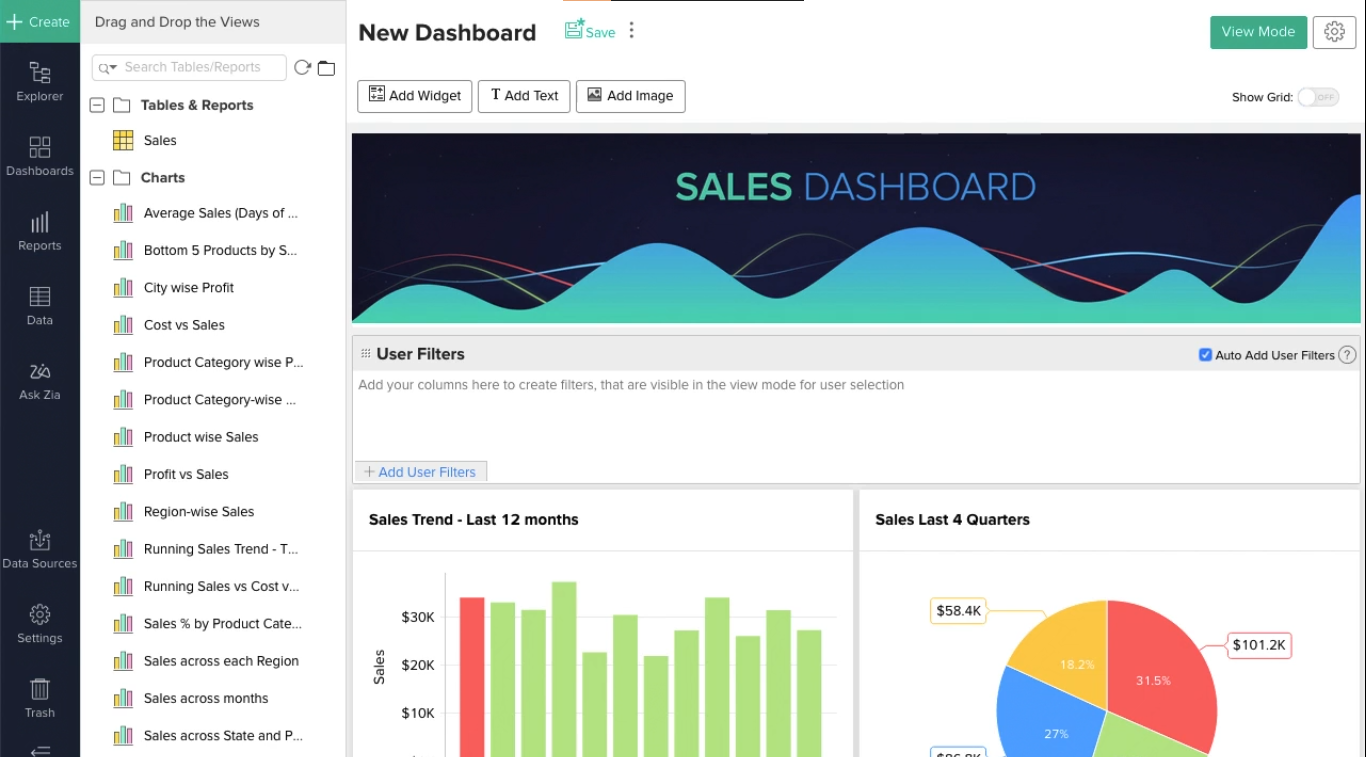
Create dynamic, customizable dashboards and reports from MySQL. These interactive tools enable real-time data analysis, letting users drill down into reports, apply filters, and visualize key insights for more informed decision-making.
Pros of Zoho Analytics
Easy to use
Affordable pricing
Cloud-based access
Cons of Zoho Analytics
Lacks advanced features
Limited customization options
Best for small to medium businesses
Zoho Analytics Pricing
Basic: $24/month
Standard: $48/month
Premium: $115/month
Enterprise: $455/month
Custom pricing is available as well.
Final Verdict on Zoho Analytics
Zoho Analytics is a practical solution for users who want to create detailed reports and dashboards using MySQL data. Its ability to sync data automatically, combined with its reporting and visualization capabilities, makes it a strong option for those who need real-time insights from their MySQL databases.
10. Devart

dbForge by Devart is a MySQL tool designed for database development, management, and reporting. It offers a range of features that make it easier to work with MySQL databases, including query building, data import/export, and reporting capabilities. With dbForge, you can create custom SQL queries or use the built-in visual query builder to generate reports without writing code. It also supports data analysis and visualization through charts and dashboards, allowing users to gain insights from their MySQL data quickly. The tool is suitable for both beginners and advanced users, with features like schema comparison, data synchronization, and database backup.
Key Features
1. Data Export and Import
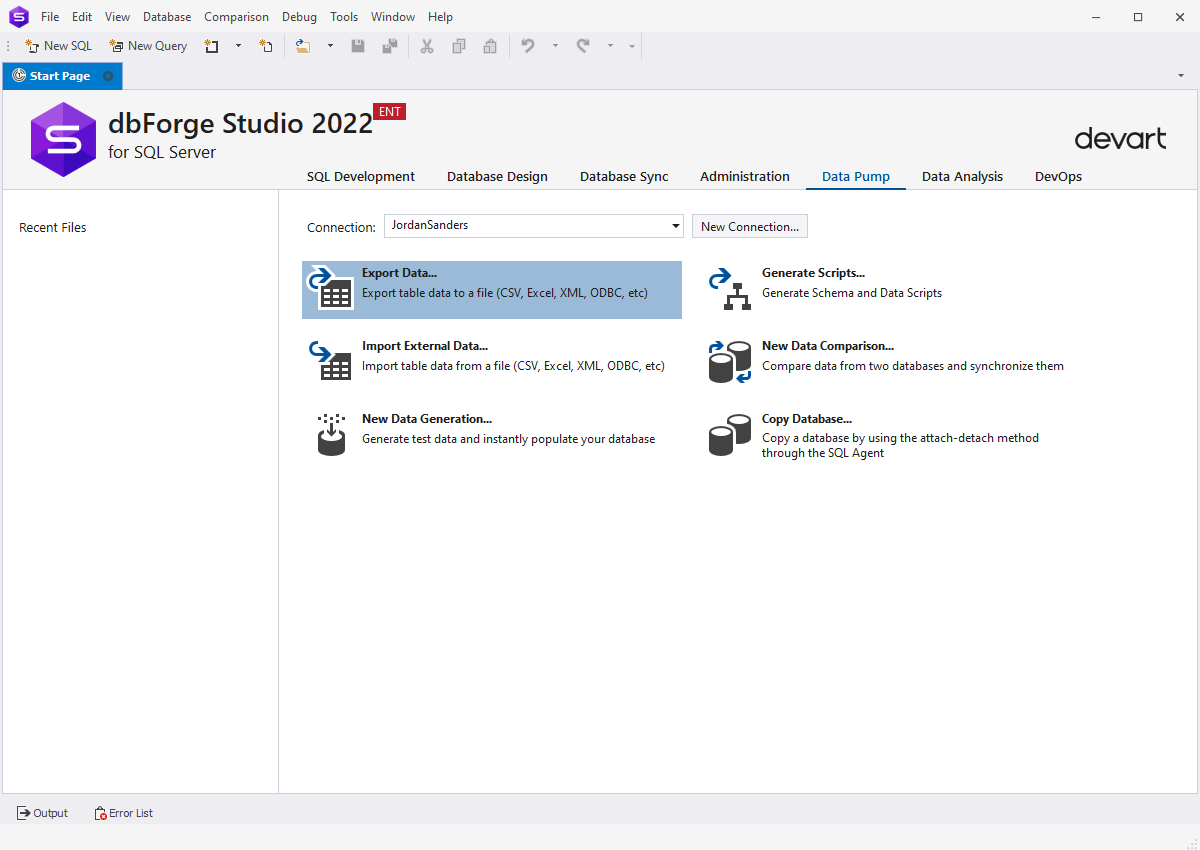
Easily transfer data between MySQL and other formats such as CSV, Excel, and XML. This functionality simplifies the data reporting process by enabling easy data migration, integration, and backup. This feature is ideal for quick SQL database management and reporting.
2. Database Monitoring and Management
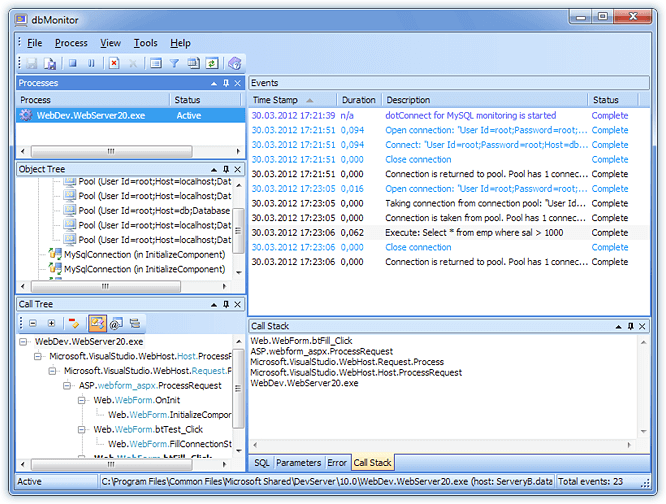
Monitor the performance of MySQL in real-time with Devart, identifying potential issues such as slow queries and resource bottlenecks. This feature ensures efficient reporting by providing detailed insights into database health and activity.
3. Data Visualization
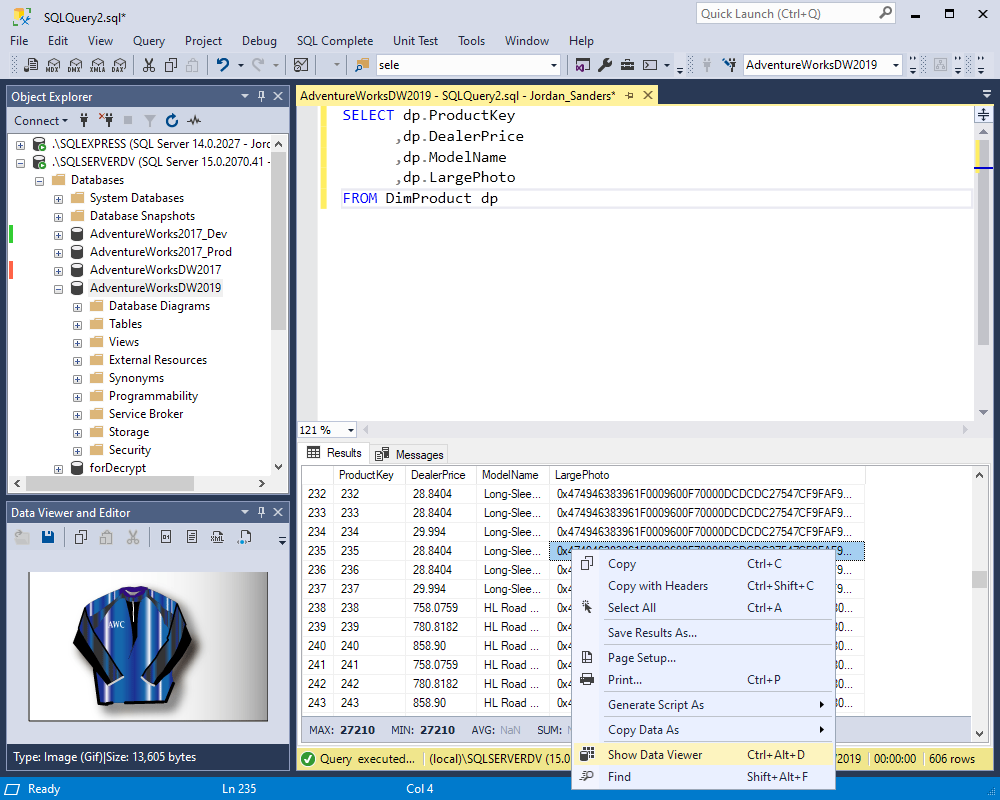
Users can generate visual reports, graphs, and dashboards from their SQL data, although the visualization options are more limited than other tools.
4. Custom Reporting
Offers tools to create detailed reports based on SQL queries or datasets. Users can generate visual reports to gain insights from their MySQL data.
5. Database Backup and Restore
Enables users to back up their MySQL databases and restore them when needed. This feature ensures data safety and recovery in case of failure.
Pros of Devart
Affordable pricing
SQL optimization tools
Multi-database support
Cons of Devart
Limited visualization features
Lacks real-time reporting
Slight learning curve
Devart Pricing
Standard: $329.95 + $40 priority support
Professional: $549.95 + $60 priority support
Professional with source code: $849.95 + $90 priority support
Final Verdict on Devart
dbForge is a powerful, all-in-one MySQL tool that provides extensive reporting, data analysis, and management capabilities. Its user-friendly interface and wide range of features make it ideal for both casual users and database professionals who need a robust solution for working with MySQL data.
Conclusion
Choosing the right SQL reporting tool depends on your specific needs, whether it’s ease of use, advanced visual reporting, or real-time analytics. Each tool offers unique features, from real-time reporting to advanced data visualizations, helping you make better decisions.
However, BlazeSQL stands out as the best option for teams looking for a fast and user-friendly solution. With its AI-powered assistant, minimal learning curve, and ability to automate complex SQL queries and reporting, BlazeSQL simplifies the entire process—making it perfect for both technical and non-technical users. Try BlazeSQL today to simplify your SQL reporting!


