Top 10 SQL Data Visualization Tools
SQL data visualization tools play a critical role in transforming raw data into clear, actionable insights. These tools help businesses create charts, dashboards, and graphs from complex datasets, making data-driven decisions easier.
Each tool offers unique features that cater to different business needs with SQL and its databases, from real-time analysis to AI-driven insights. Choosing the right tool can significantly impact how efficiently your team interprets and acts on data.
1. BlazeSQL
BlazeSQL is an easy-to-use tool that turns your SQL data into visual insights in seconds with AI by connecting with your SQL database. It's ideal for product managers, marketing, sales, operations staff, CTOs, and CEOs. Just ask a question and extract the needed data, and BlazeSQL will create the perfect visual for you. Users can easily interact with this AI chatbot without needing any coding or technical skills. You can even build dashboards by simply telling the AI what you need.
Key Features
1. Data Visualization
BlazeSQL simplifies data analysis by allowing you to visualize data through simple questions. The AI-driven chatbot retrieves and displays insights, making your SQL data easy to understand without having a need for technical skills.
2. AI Analytics Assistant
Your personal AI analytics assistant and chatbot allow users to input natural language queries, generate SQL queries, and handle data analysis, making insights faster and accessible to everyone. It saves time for technical users and empowers non-SQL users with easy access to data insights.
3. Data Security
BlazeSQL ensures top-level data security by adhering to strict encryption protocols and secure access controls. Your data remains protected throughout the entire analysis process, safeguarding both storage and retrieval.
4. Dashboards
Create and customize dashboards in BlazeSQL by simply instructing the AI, making it easy to monitor key metrics and data insights in one place.
5. AI-Driven Data Enrichment
BlazeSQL enhances your data by automatically pulling and organizing relevant information, making it ready for immediate analysis and visualization.
6. AI-Generated Weekly Reporting
BlazeSQL simplifies weekly changes in reporting with AI-driven automation, reducing the time and effort required to generate detailed reports from SQL data.
7. Team Collaboration
The platform supports collaborative work environments, enabling teams to share dashboards, insights, and reports seamlessly.
Pros of BlazeSQL
- User-Friendly interface
- Supports multiple SQL databases, including Snowflake, PostgreSQL, MySQL
- Efficient data analysis
Cons of BlazeSQL
- A paid subscription is required for continued use after the trial period.
BlazeSQL Pricing
- Blaze Pro: $39/month
- Blaze Advanced: $99/month
- Blaze Team: Starting at $149/month
- Blaze Team Advanced: Starting at $499/month (includes 3 users, $75 per extra user)
- Blaze Enterprise: Custom pricing is available
Final Verdict
BlazeSQL is a game-changer for anyone looking to simplify data visualization and reporting. Its user-friendly interface and powerful AI-driven features make it accessible to both technical and non-technical users. The ease of use, combined with powerful automation, makes BlazeSQL a top choice for efficient and effective data management. If you're ready to streamline your data processes, BlazeSQL is the tool you need.
Get started today and transform your data analysis with BlazeSQL!
2. Looker Studio

Looker Studio is a self-service business intelligence tool that makes visualizing SQL data comprehensible. With Looker Studio, you can quickly create and share engaging reports and dashboards by connecting to SQL databases. The tool is flexible and customizable, allowing you to build meaningful charts and graphs.
Key Features
1. Data Exploration
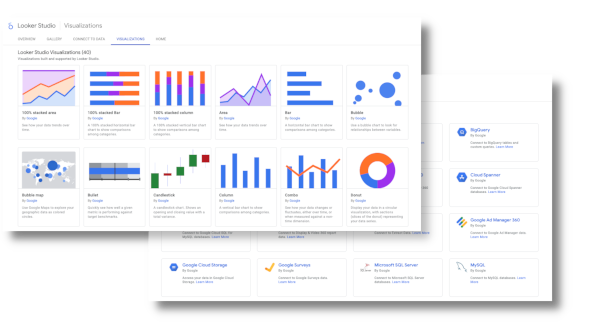
Looker Studio allows users to explore their SQL data in-depth with comfortable visualization features that facilitate the discovery of new insights. The platform supports complex SQL queries, which are transformed into visual representations that are easy to interpret.
2. Easy-to-Use Web Interface
Looker Studio offers a drag-and-drop editor with customizable property panels and a snap-to-grid canvas, making report creation simple and user-friendly.
3. Report Templates
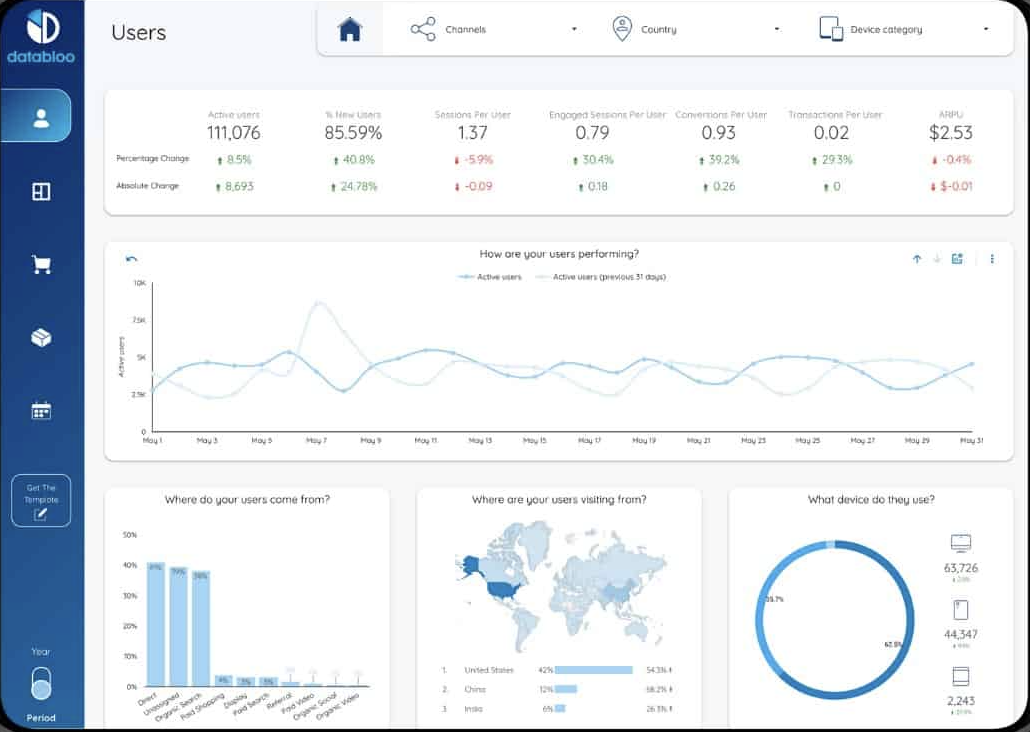
Quickly turn your SQL data into insightful visualizations by choosing from a variety of report templates. Connect your SQL sources and customize the design effortlessly.
4. Report Embedding
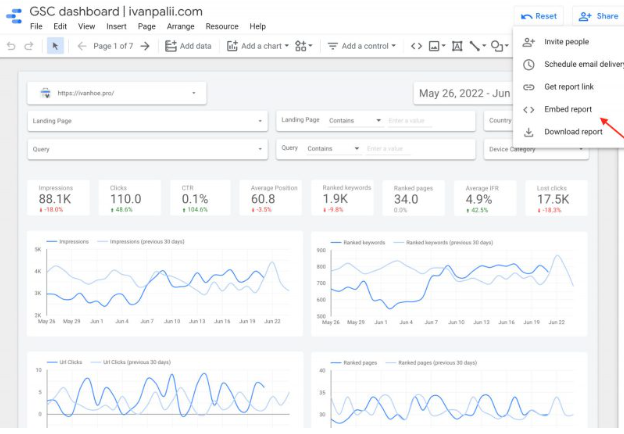
Easily embed your SQL reports into any web page or intranet, allowing you to share insights with your team or the wider audience.
5. Looker Studio API
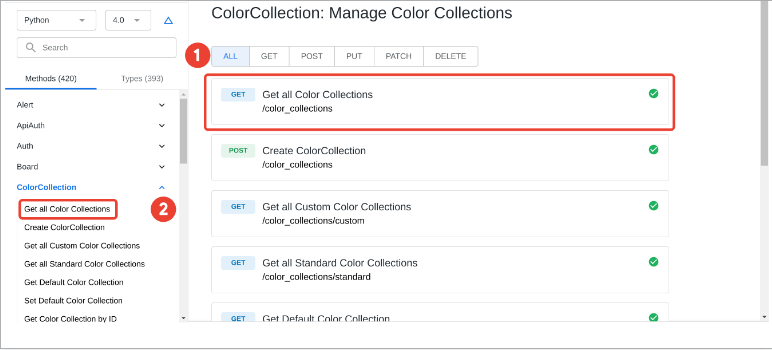
The Looker Studio API helps automate the management and migration of SQL data assets, making it easy for organizations using Google Workspace or Cloud Identity.
Pros of Looker Studio
- Easy integration with the Google ecosystem
- Real-time analytics
- Customizable dashboards
Cons of Looker Studio
- Limited customization compared to competitors
- Can be slow with large datasets
- Requires a Google account for full functionality
- Less suitable for complex, enterprise-level reporting
- Advanced features may require a learning curve
Looker Studio Pricing
Standard Edition:
- Pay as you go: $0.04 per slot hour (billed per second with a 1-minute minimum)
Enterprise Edition:
- Pay as you go: $0.06 per slot hour (billed per second with a 1-minute minimum)
- 1-year commitment: $0.048 per slot hour
- 3-year commitment: $0.036 per slot hour
Enterprise Plus Edition:
- Pay as you go: $0.10 per slot hour (billed per second with a 1-minute minimum)
- 1-year commitment: $0.08 per slot hour
- 3-year commitment: $0.06 per slot hour
Storage Pricing:
- Active logical storage: $0.02 per GiB per month (first 10 GiB free each month)
- Long-term logical storage: $0.01 per GiB per month (first 10 GiB free each month)
- Active physical storage: $0.04 per GiB per month (first 10 GiB free each month)
- Long-term physical storage: $0.02 per GiB per month (first 10 GiB free each month)
Final Verdict
Looker Studio is an excellent tool for businesses looking to integrate SQL data visualization with SQL databases. Its real-time analytics, seamless integration with other Google products, and customizable dashboards make it a strong contender for those seeking a comprehensive data visualization solution. However, some initial effort may be required to master its features.
3. Toucan Toco

Toucan Toco is a no-code embedded analytics and business intelligence tool that integrates seamlessly with numerous SQL databases for data visualization. It offers an easy-to-use interface designed for non-technical users, focusing on end-user analytics, and provides customization and white labeling options for visualizations and dashboards. However, extensive customizations may require a Toucan expert, and specialty databases might need a data expert for integration.
Key Features
1. Storytelling Studio
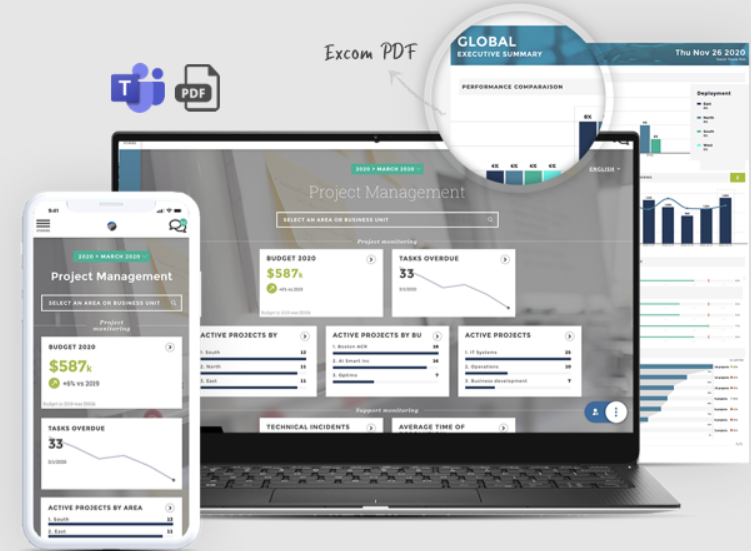
Toucan Toco’s Storytelling Studio enables users to build data-driven narratives by combining SQL data with visual elements. This feature helps make complex data more accessible and understandable to a wider audience.
2. No-code Embedded Analytics
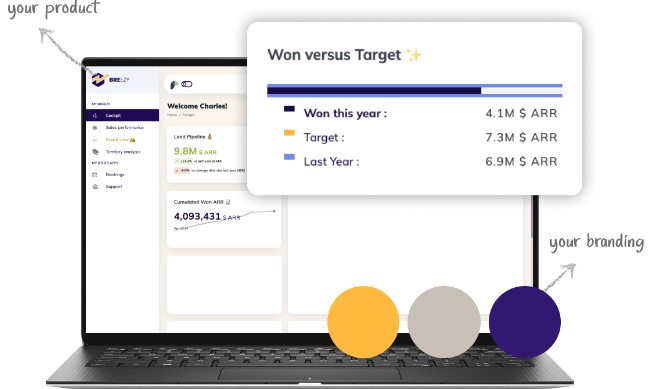
Toucan Toco enables SQL data visualization without writing a single line of code, allowing users to integrate and visualize data from any database effortlessly.
3. End-User Analytics
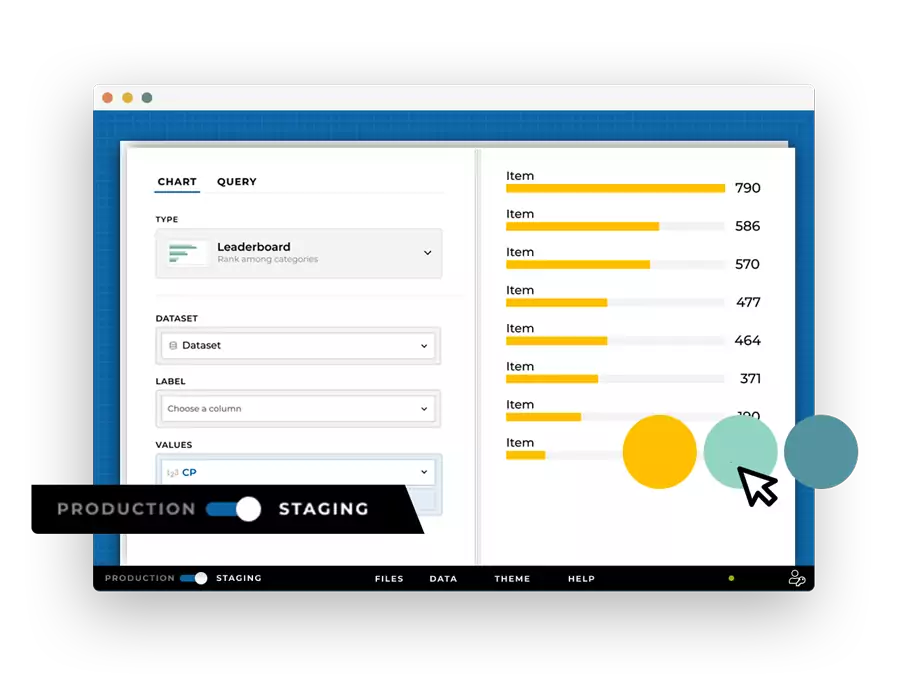
Designed for non-technical users, Toucan Toco focuses on making SQL data easily accessible and understandable, empowering end-users to derive insights directly.
4. Easy-to-Use Interface
Toucan Toco offers an intuitive interface, simplifying the process of SQL data visualization so that even users without technical expertise can create impactful reports.
5. Annotate and Share Features
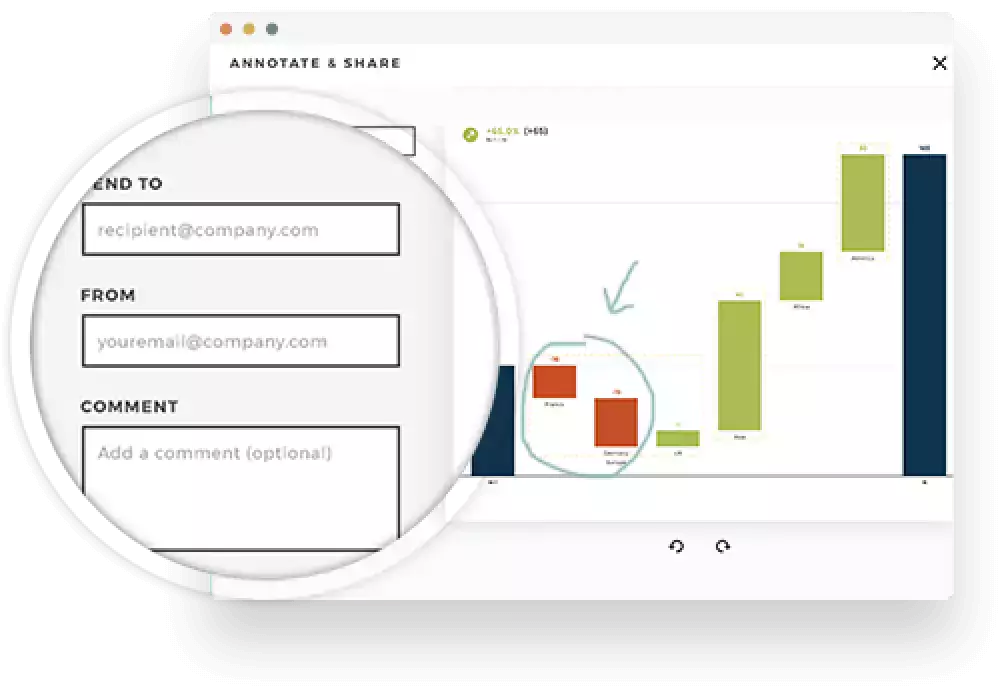
Toucan Toco allows users to annotate SQL visualizations and easily share them as PDFs or Slack messages, facilitating collaboration and communication within teams.
Pros of Toucan Toco
- No-code platform, easy for non-technical users
- Highly customizable visualizations
- Strong focus on end-user experience
Cons of Toucan Toco
- Limited advanced features for power users
- May require expert help for extensive customizations
- Specialty database integrations may need additional setup
- Not ideal for exporting to formats like PowerPoint
- Higher pricing for advanced features
Toucan Toco Pricing
- Free trial available
- Custom pricing
Final Verdict
Toucan Toco is another choice for SQL data visualization, especially for non-technical users who need powerful insights without the complexity of coding. Its no-code embedded analytics, easy-to-use interface, and focus on end-user accessibility make it stand out. With customization, annotation, and seamless sharing, Toucan ensures your data is impactful and collaborative.
4. Zoho Analytics

Zoho Analytics makes data visualizations using SQL easy. Connect your Microsoft SQL database effortlessly and create dynamic charts, pivot tables, and dashboards in minutes. The platform goes beyond visuals, offering in-depth data analysis with filters, formulas, and predictive analytics. Share interactive reports across your organization quickly, keeping everyone on the same page.
Key Features
1. Customizable Dashboards
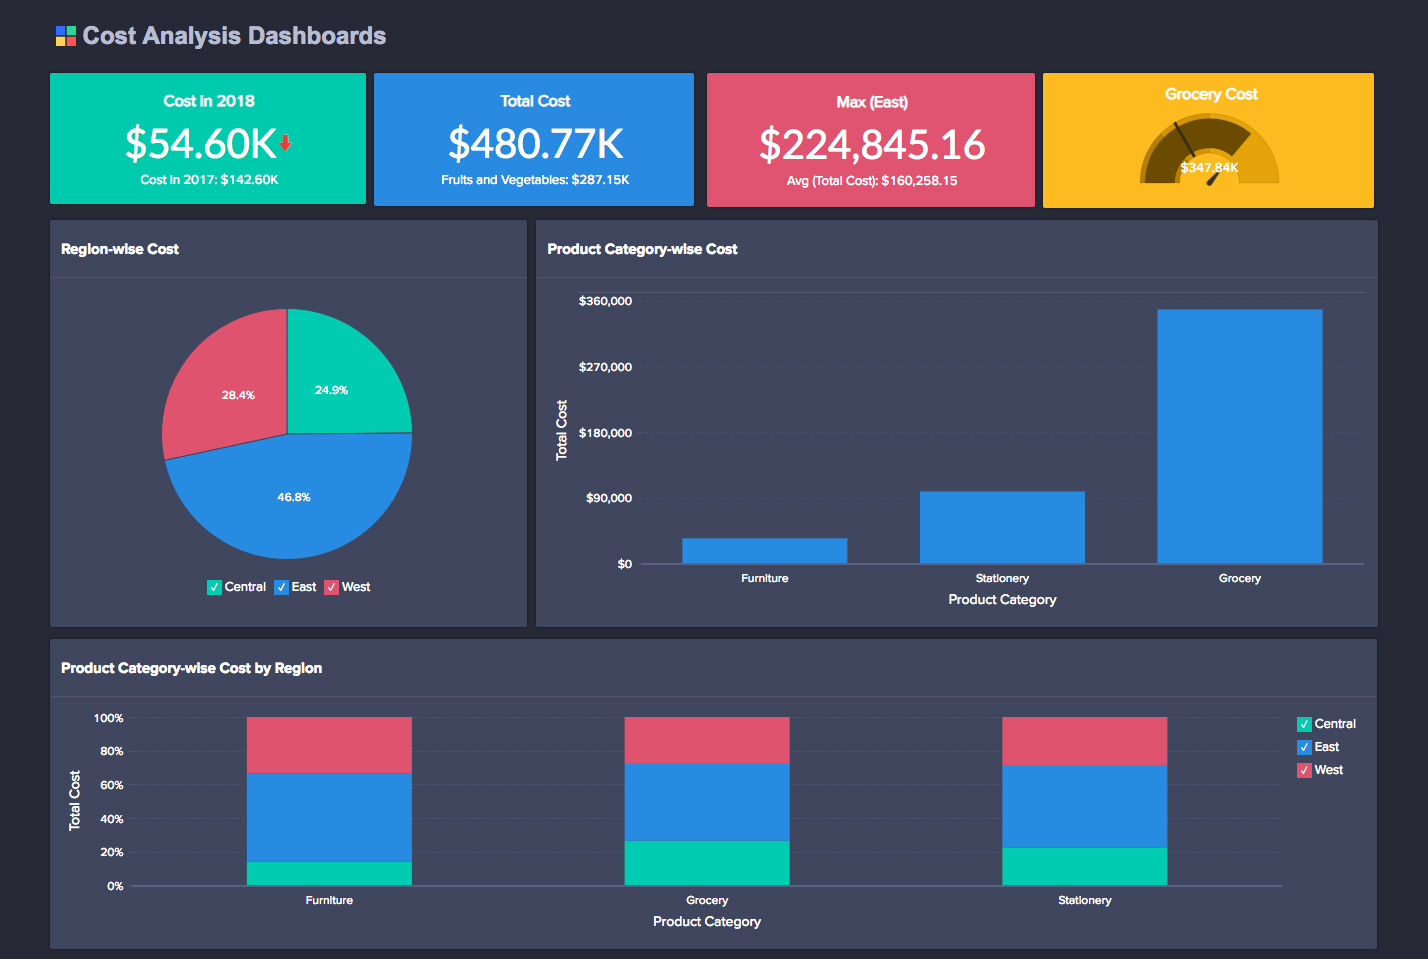
Zoho Analytics offers highly customizable dashboards, allowing users to tailor visualizations to their business needs. Users can create charts, graphs, and other visual elements to represent SQL data effectively.
2. Ad-Hoc Reporting
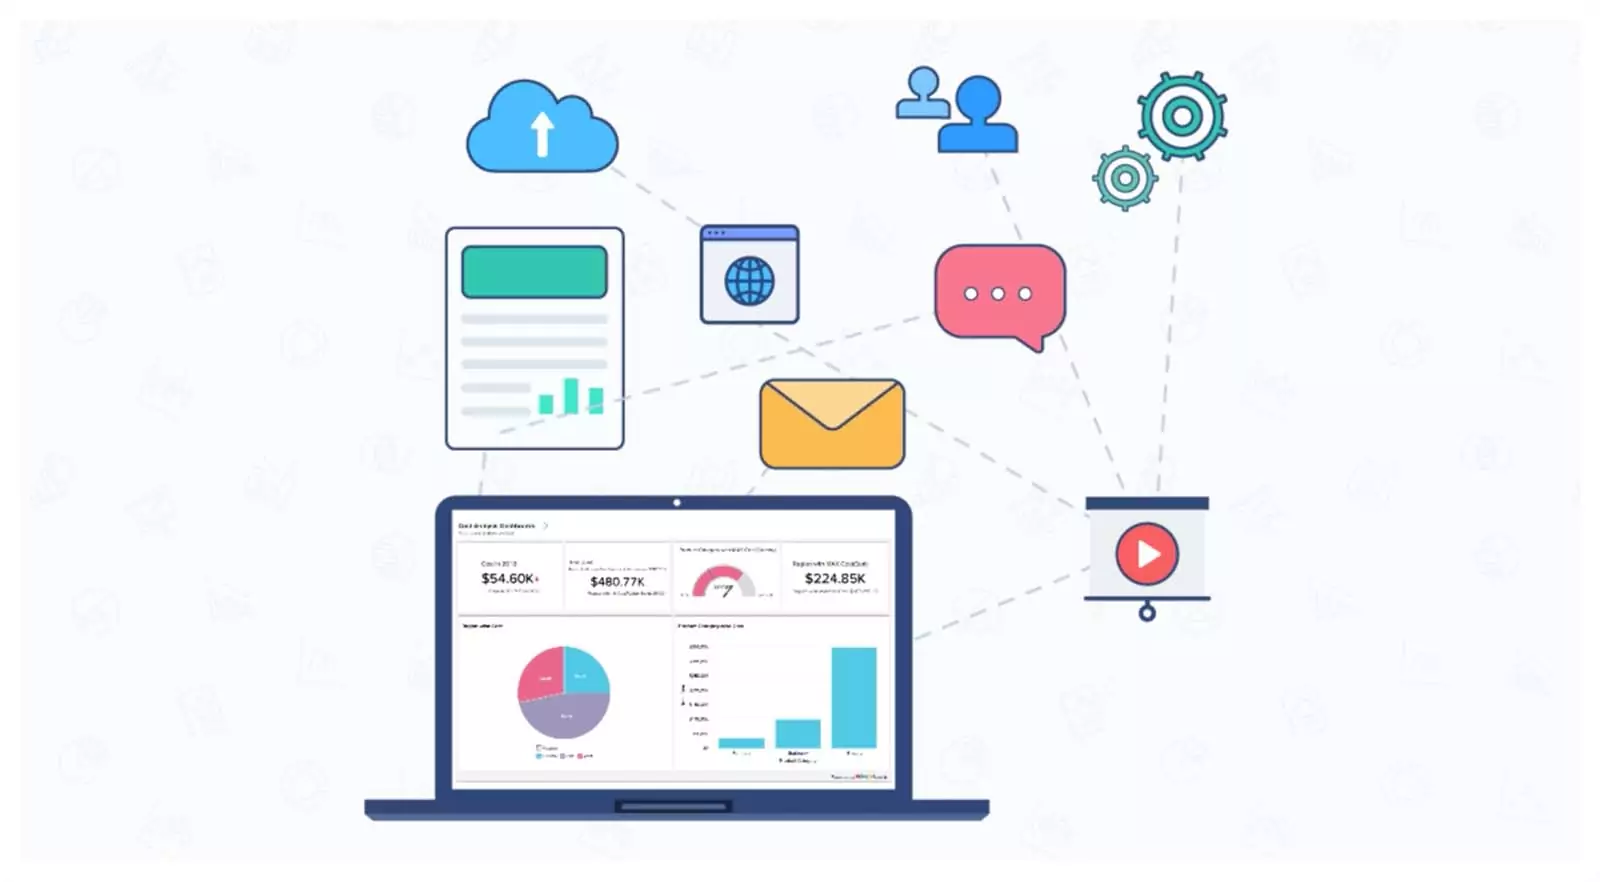
With Zoho Analytics, users can generate ad-hoc reports on the fly, providing flexibility in how data is analyzed and presented. This feature is particularly useful for businesses that need quick insights without extensive report setup.
3. Embedded Analytics

Zoho Analytics supports embedded analytics, allowing businesses to integrate SQL data visualizations into their existing applications and workflows.
4. AI-Powered Insights
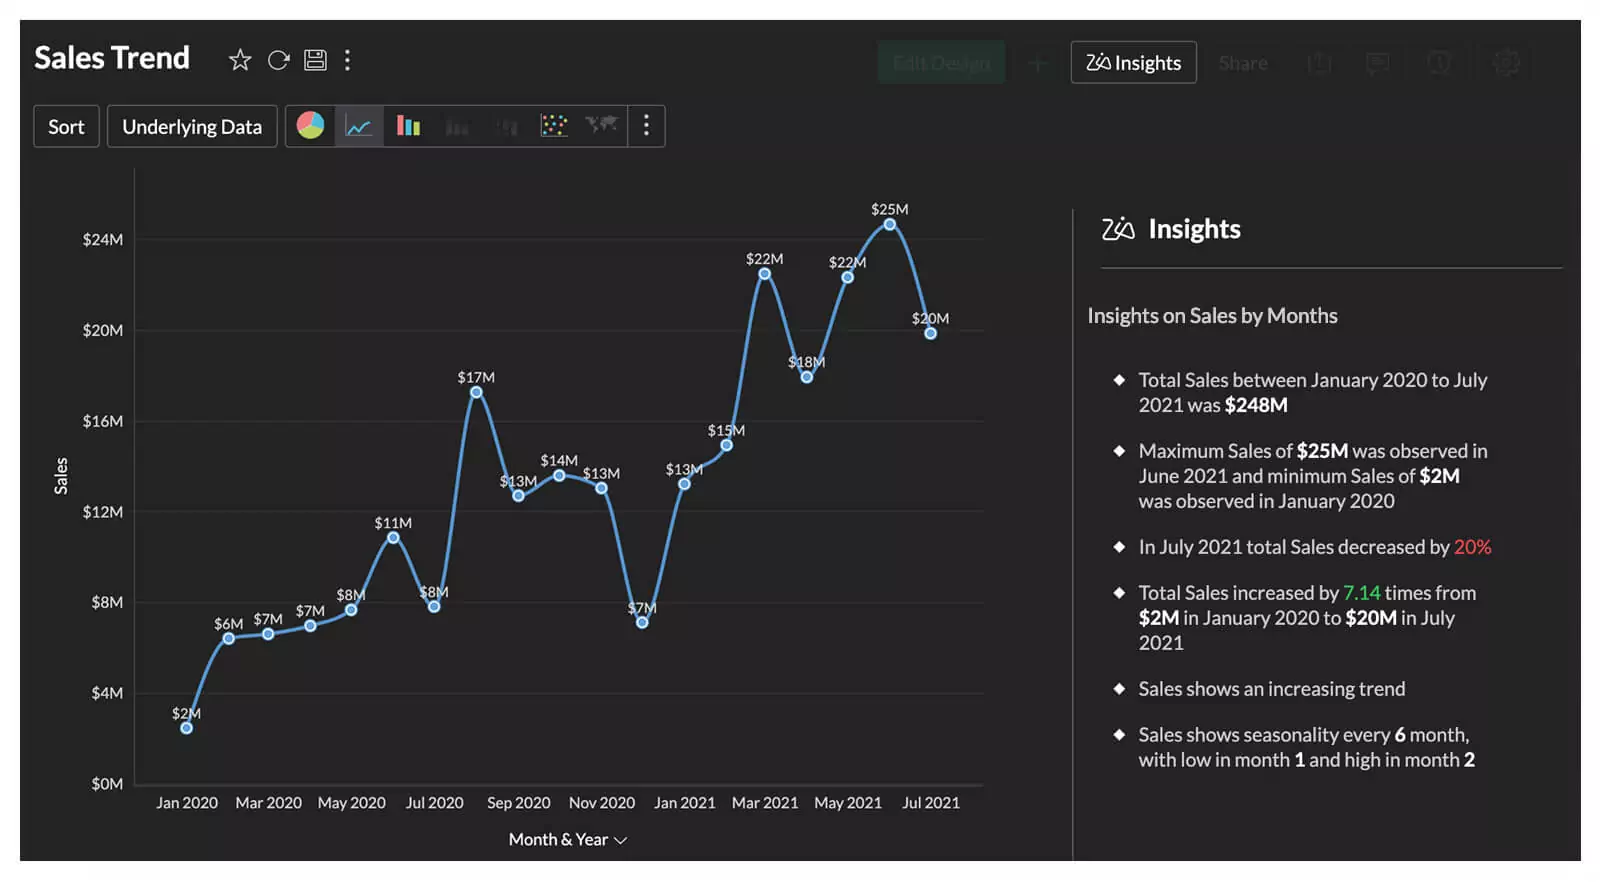
The platform uses AI to generate insights from SQL data, helping users identify trends, patterns, and anomalies that might go unnoticed.
Pros of Zoho Analytics
- Strong integration with Microsoft SQL and other databases
- Wide range of visualization options
- Easy-to-use interface, even for beginners
- Predictive analytics and AI features
Cons of Zoho Analytics
- Performance can lag with very large datasets
- Limited advanced customization options
- Customer support can be slow at times
- Some features require higher-tier plans
- Learning curve for non-Zoho users
Zoho Analytics Pricing
- Free trial available
- Basic Plan: Starting at $24/month
- Standard Plan: Starting at $48/month
- Premium Plan: Starting at $115/month
- Enterprise Plan: Starting at $455/month
- Custom plans available
Final Verdict
Zoho Analytics is a versatile and affordable tool for businesses looking to enhance their SQL data visualization capabilities. Its wide range of features, including customizable dashboards and AI-driven insights, make it a strong choice for businesses of all sizes. However, users should be prepared for a learning curve, especially when dealing with large datasets.
5. Qlik

Qlik is a leading business intelligence platform that offers powerful SQL data visualization tools. Known for its associative data engine, Qlik allows users to explore and analyze SQL data in ways that traditional linear models do not. The platform is designed for users who need to create dynamic visualizations from SQL data, making it a popular choice among data professionals.
Key Features
1. No-Code Visualizations
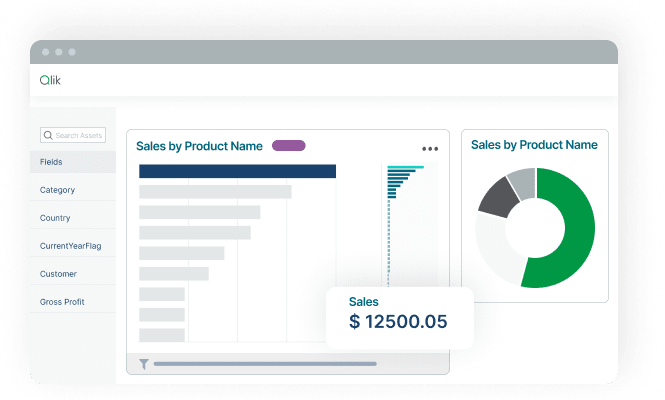
Qlik enables you to create dynamic and engaging visualizations from SQL data without coding, allowing you to explore and present data effortlessly.
2. Customizable Dashboards
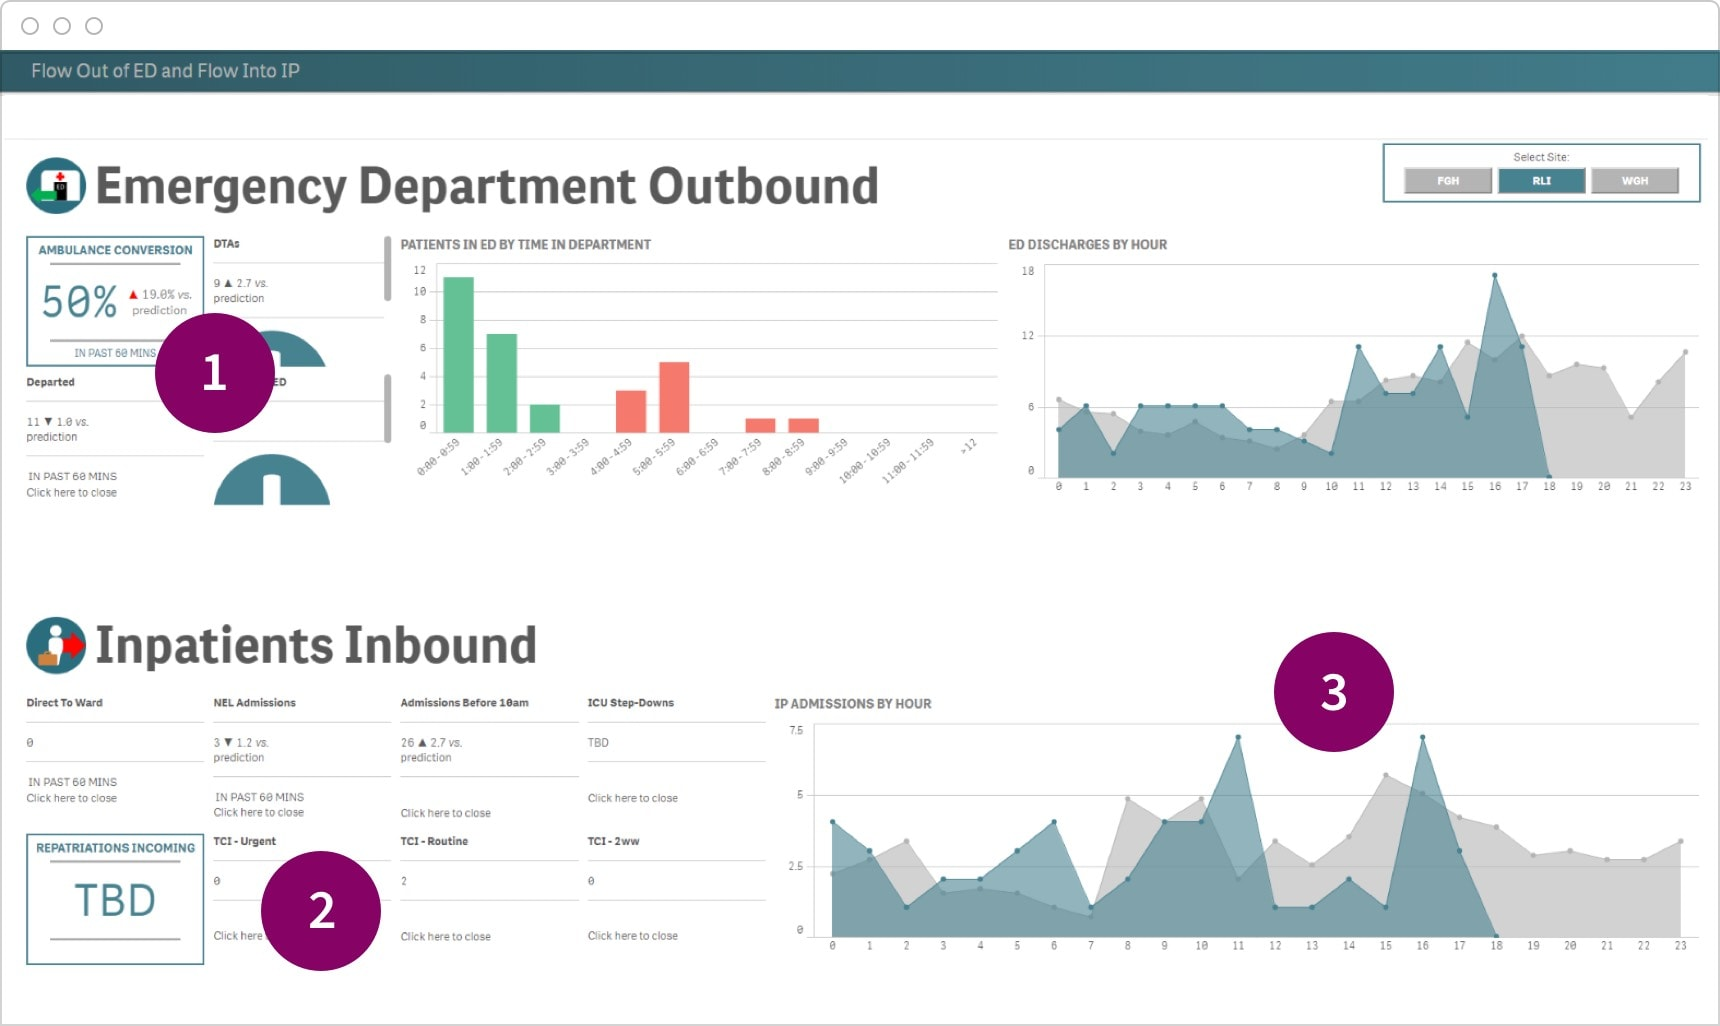
Design fully customizable dashboards with gridless layouts, stacked elements, and unique color schemes, providing flexibility in presenting SQL data.
3. Associative Data Engine
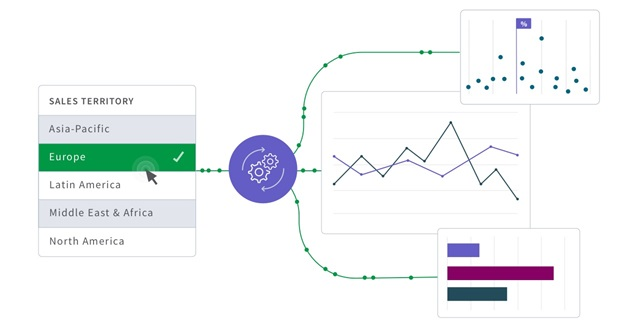
Use Qlik's AI capabilities combined with its Associative Engine to explore SQL data freely, uncovering insights you might not have considered. This feature allows users to navigate through data non-linearly, making connections across different datasets.
4. Data Exploration
Make selections in any direction within Qlik’s visualizations to refine context, enabling instant and in-depth analysis of SQL data.
Pros of Qlik
- Powerful associative data engine
- Highly interactive visualizations
- Strong data exploration capabilities
- AI-driven insights and analytics
Cons of Qlik
- Steeper learning curve for beginners
- Higher cost compared to some competitors
- May require technical support for complex setups
- Can be resource-intensive with large datasets
- Customization can be challenging for non-technical users
Qlik Pricing
- Qlik offers custom pricing plans
Final Verdict
Qlik is a top-tier tool for businesses that require advanced SQL data visualization capabilities. Its associative data engine and augmented analytics set it apart from traditional tools, offering unique insights into complex datasets. However, its complexity and pricing may be a consideration for smaller businesses or those with limited technical resources.
6. Sisense

Sisense is a business intelligence platform that excels in SQL data visualization. It is designed to handle large and complex datasets, making it an ideal solution for enterprises that require powerful analytics tools. Sisense integrates SQL data from various sources, allowing users to create comprehensive visualizations that drive informed decision-making. With its advanced analytics features and customizable dashboards, Sisense is a top choice for businesses that need to visualize SQL data effectively.
Key Features
1. In-Chip Technology
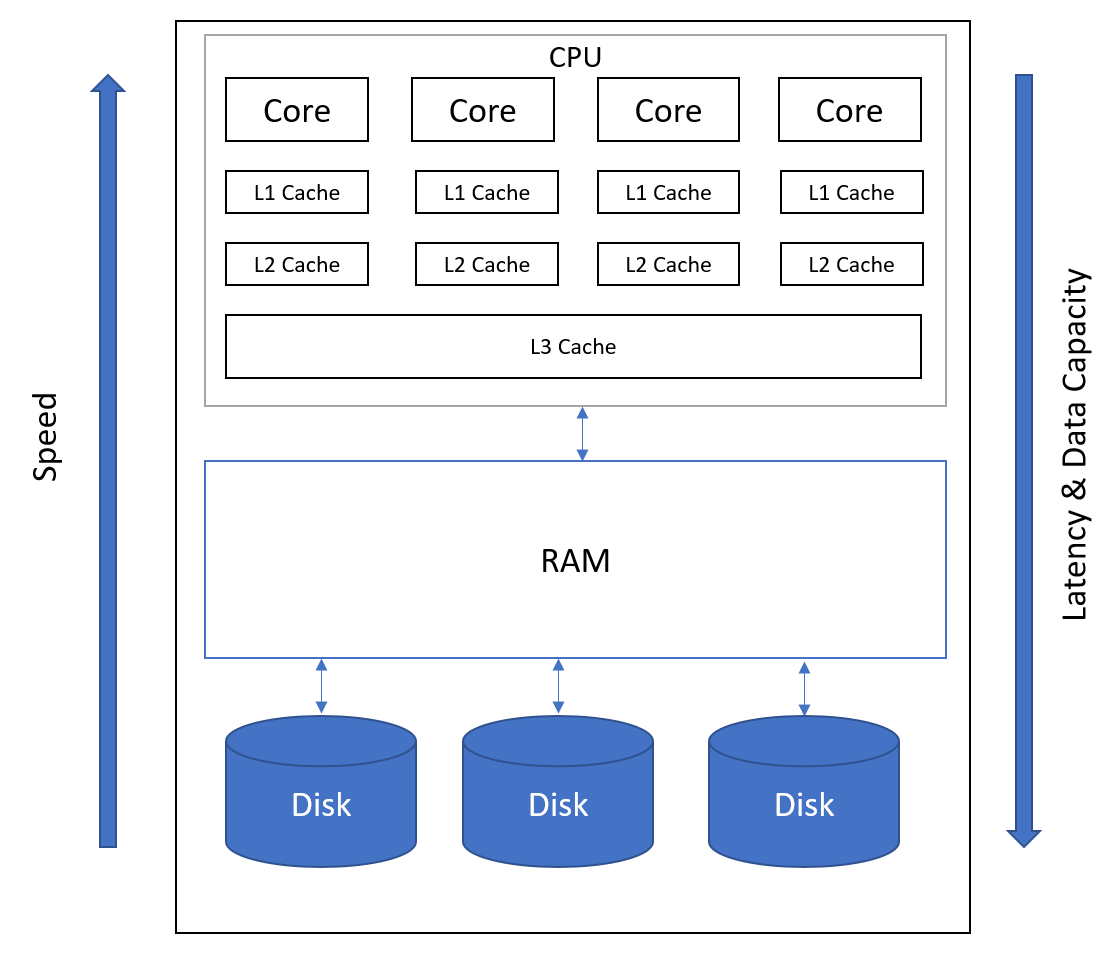
Sisense’s In-Chip technology optimizes data processing, allowing users to analyze large SQL datasets quickly and efficiently. This feature ensures that visualizations are generated in real time, even for complex queries.
2. Dashboards
Sisense provides dashboards that are fully customizable, enabling users to tailor visualizations to their specific needs. The platform supports various chart types, graphs, and other visual elements.
3. Data Visualizations
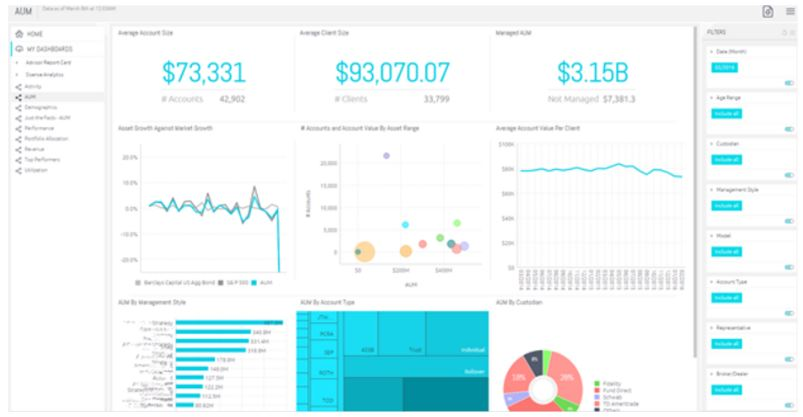
All visual elements within Sisense dashboards are interactive, enabling users to filter, drill down, and explore data insights in real time to make informed decisions.
4. Blox
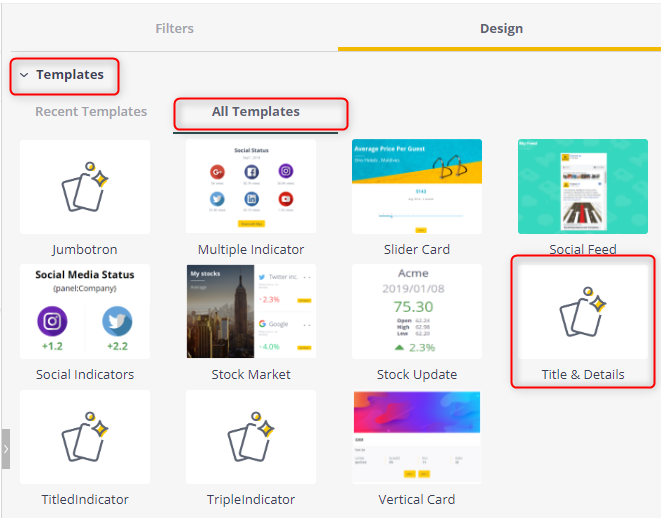
Blox lets users create highly customized, app-like visualizations using prebuilt templates and a low-code environment, allowing enhanced functionality and user interaction within dashboards.
5. Reports
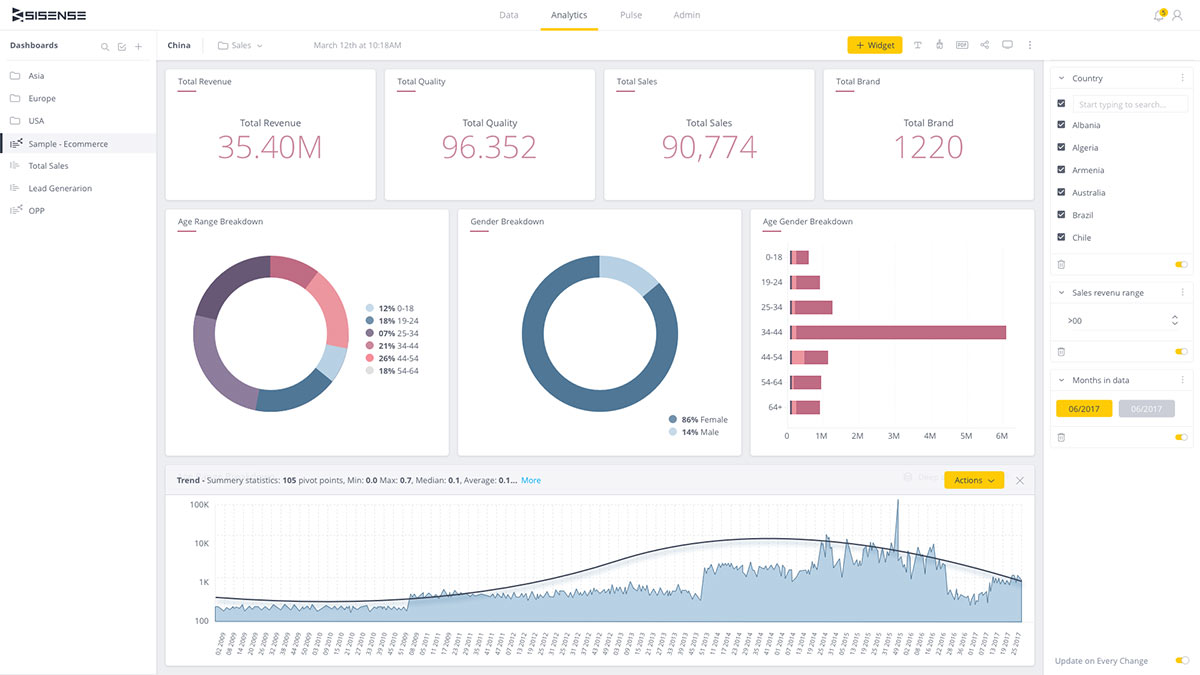
Sisense supports easy sharing of dashboards through links or scheduled reports, with options to export widgets and customize reports for broader distribution.
6. AI-Driven Insights
The platform uses AI to generate insights from SQL data, helping users identify trends, patterns, and anomalies that might go unnoticed.
Pros of Sisense
- Optimized for analyzing large and complex SQL datasets
- Offers extensive customization options for visualizations
- Provides real-time data processing for quick insights
Cons of Sisense
- May require some learning for advanced customization
- Performance can be affected by very large datasets
- Limited export options compared to some competitors
- Customization might need technical support for complex setups
Sisense Pricing
- Custom Pricing: Pricing information is available upon request.
Final Verdict
Sisense is a tool for enterprises that handle large and complex SQL datasets. Its advanced features, including In-Chip technology and AI-driven insights, make it an excellent choice for businesses that require real-time data processing and customizable visualizations. However, its pricing and complexity may be a consideration for smaller companies or those with limited technical resources.\
7. Domo

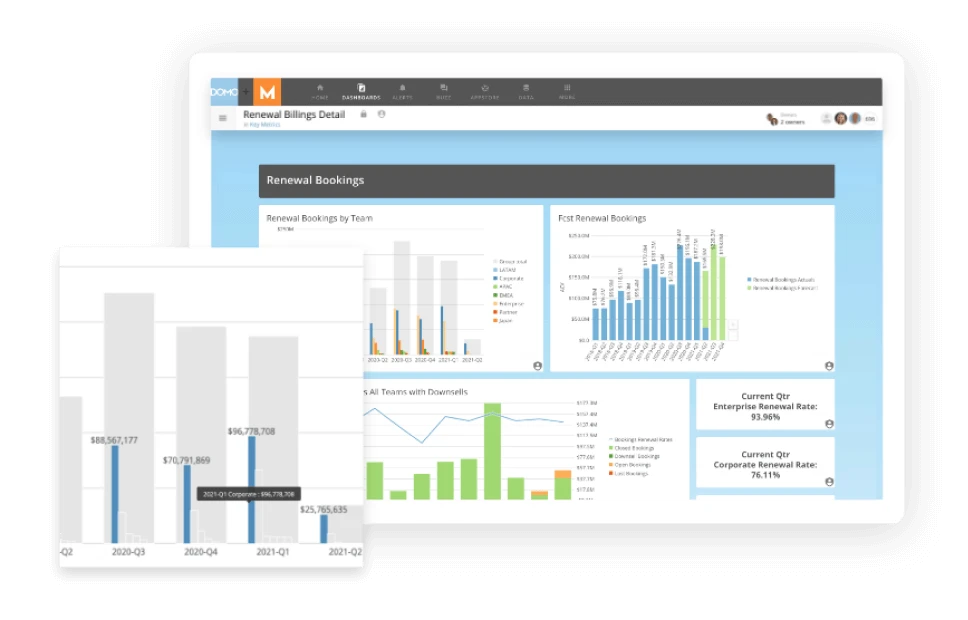
Domo is a simple tool that helps teams make decisions using real-time data. It offers easy-to-use visualizations and dashboards that let you quickly explore and act on your data. With Domo, you can create reports, share insights, and even use AI to find important trends without needing technical skills. It’s designed to ensure your data is accessible and understood by everyone in your business.
Key Features
1. SQL-Based Visualizations & Dashboards
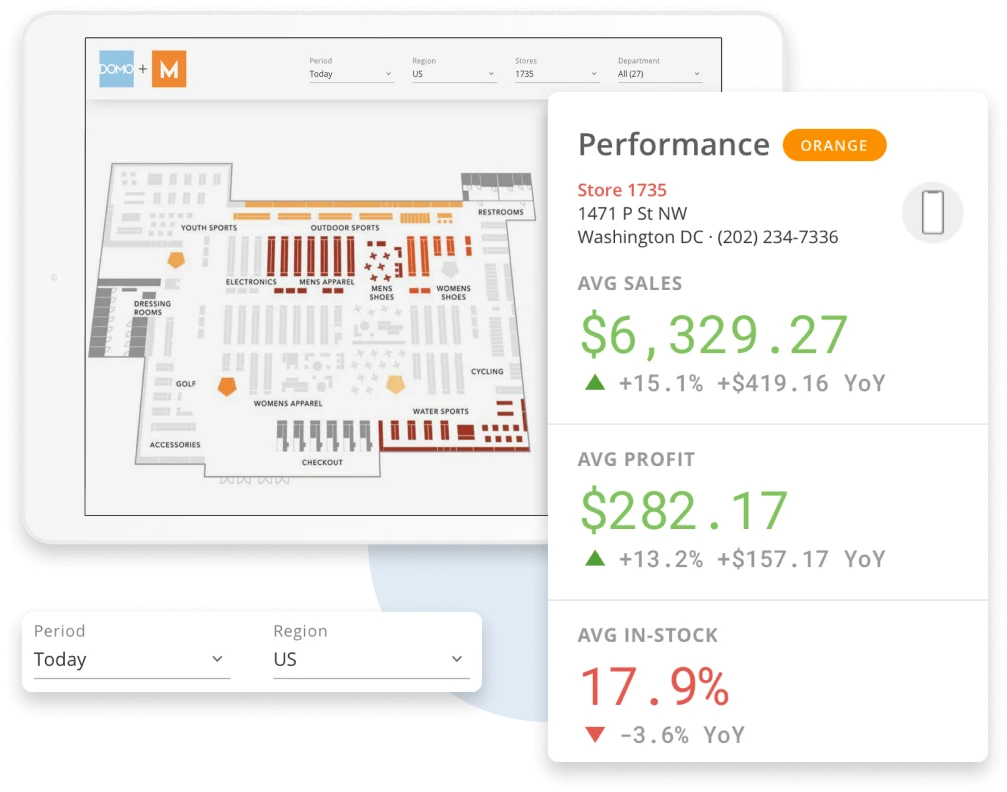
Domo allows you to create visualizations and dashboards directly from SQL queries, making it easy to see your SQL data in real-time.
2. SQL Reporting & Self-Service Analytics
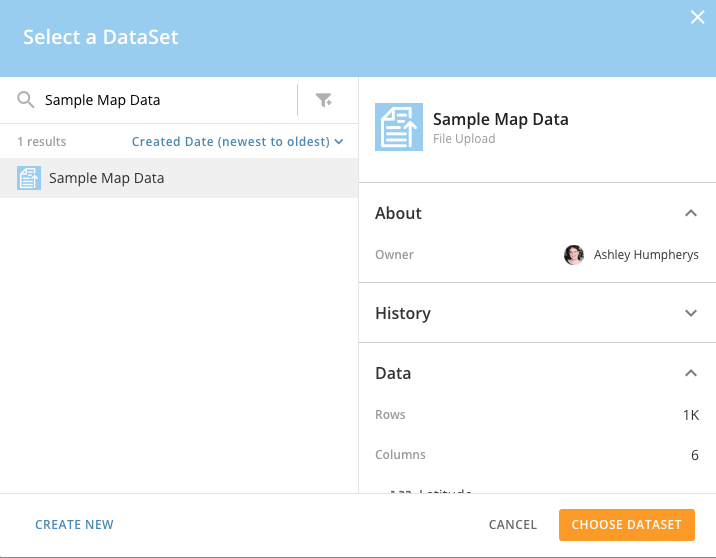
With Domo, you can generate reports from your SQL data and enable team members to explore the data using SQL without needing deep technical knowledge.
3. Domo.AI for SQL Insights
Domo’s AI analyzes SQL query results to automatically identify trends and insights, helping you take action based on the data your SQL queries generate.
5. Embedded Analytics
Domo supports embedded analytics, enabling businesses to integrate SQL data visualizations into their existing applications.
Pros of Domo
- AI-powered insights from SQL data
- Self-service reporting for non-technical users
- Easy sharing and collaboration features
Cons of Domo
- Can be complex for beginners
- May require some learning for advanced SQL features
- Performance can be affected by very large SQL datasets
- Limited customization options in some areas
Domo Pricing
- Pricing information is available upon request.
Final Verdict
Domo is a user-friendly tool for businesses looking to enhance their SQL data visualization capabilities. Its real-time data integration and powerful analytics tools make it a strong choice for organizations of all sizes. However, beginners might face a learning curve, and handling large datasets can sometimes be challenging.
8. InsightBase

InsightBase is an AI-driven analytics platform designed to simplify SQL data visualization. It offers a range of tools that allow users to explore, analyze, and visualize SQL data through dashboards and reports. InsightBase is particularly well-suited for small to medium-sized businesses looking to use AI for data-driven decision-making. With its user-friendly interface and advanced analytics capabilities, InsightBase provides a comprehensive solution for SQL data visualization.
Key Features
1. AI-Driven Analytics
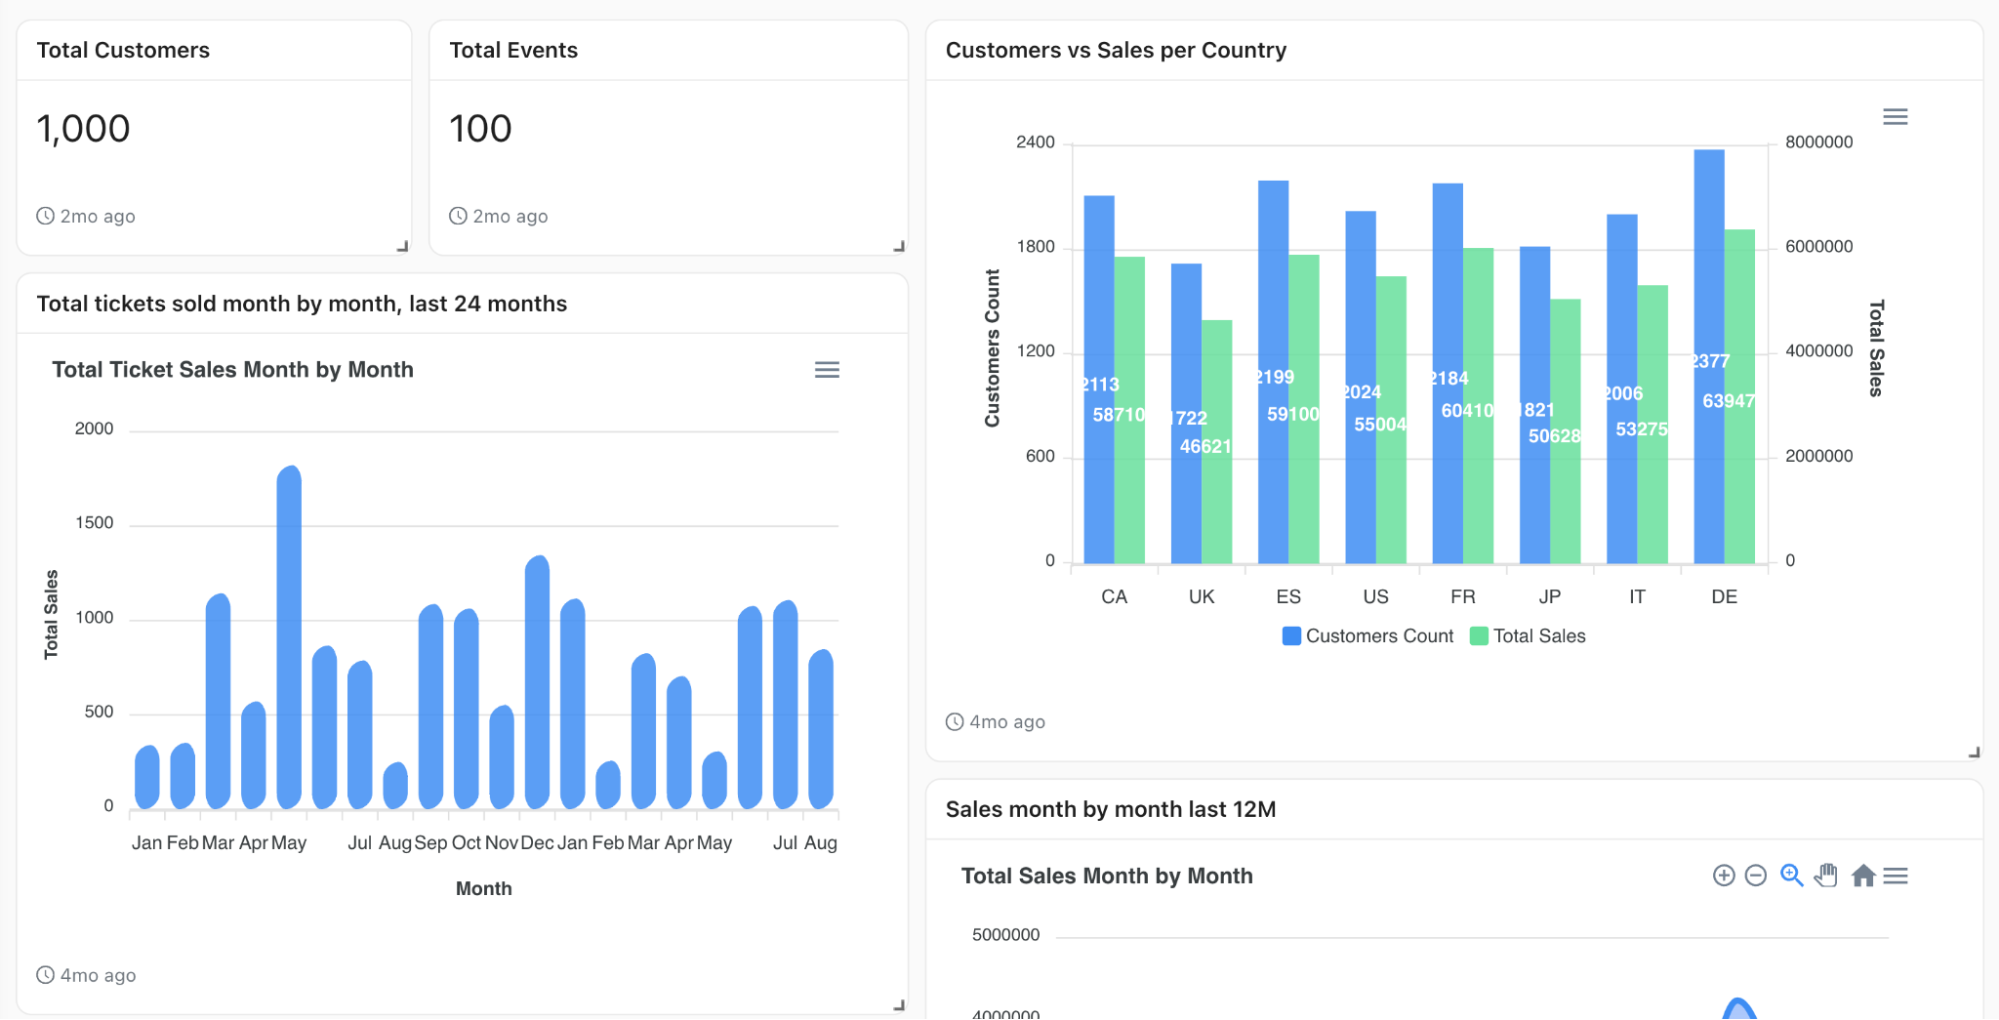
InsightBase uses AI to analyze SQL data, providing users with insights that might otherwise go unnoticed. This feature helps businesses make informed decisions based on accurate and timely data.
2. Interactive Dashboards
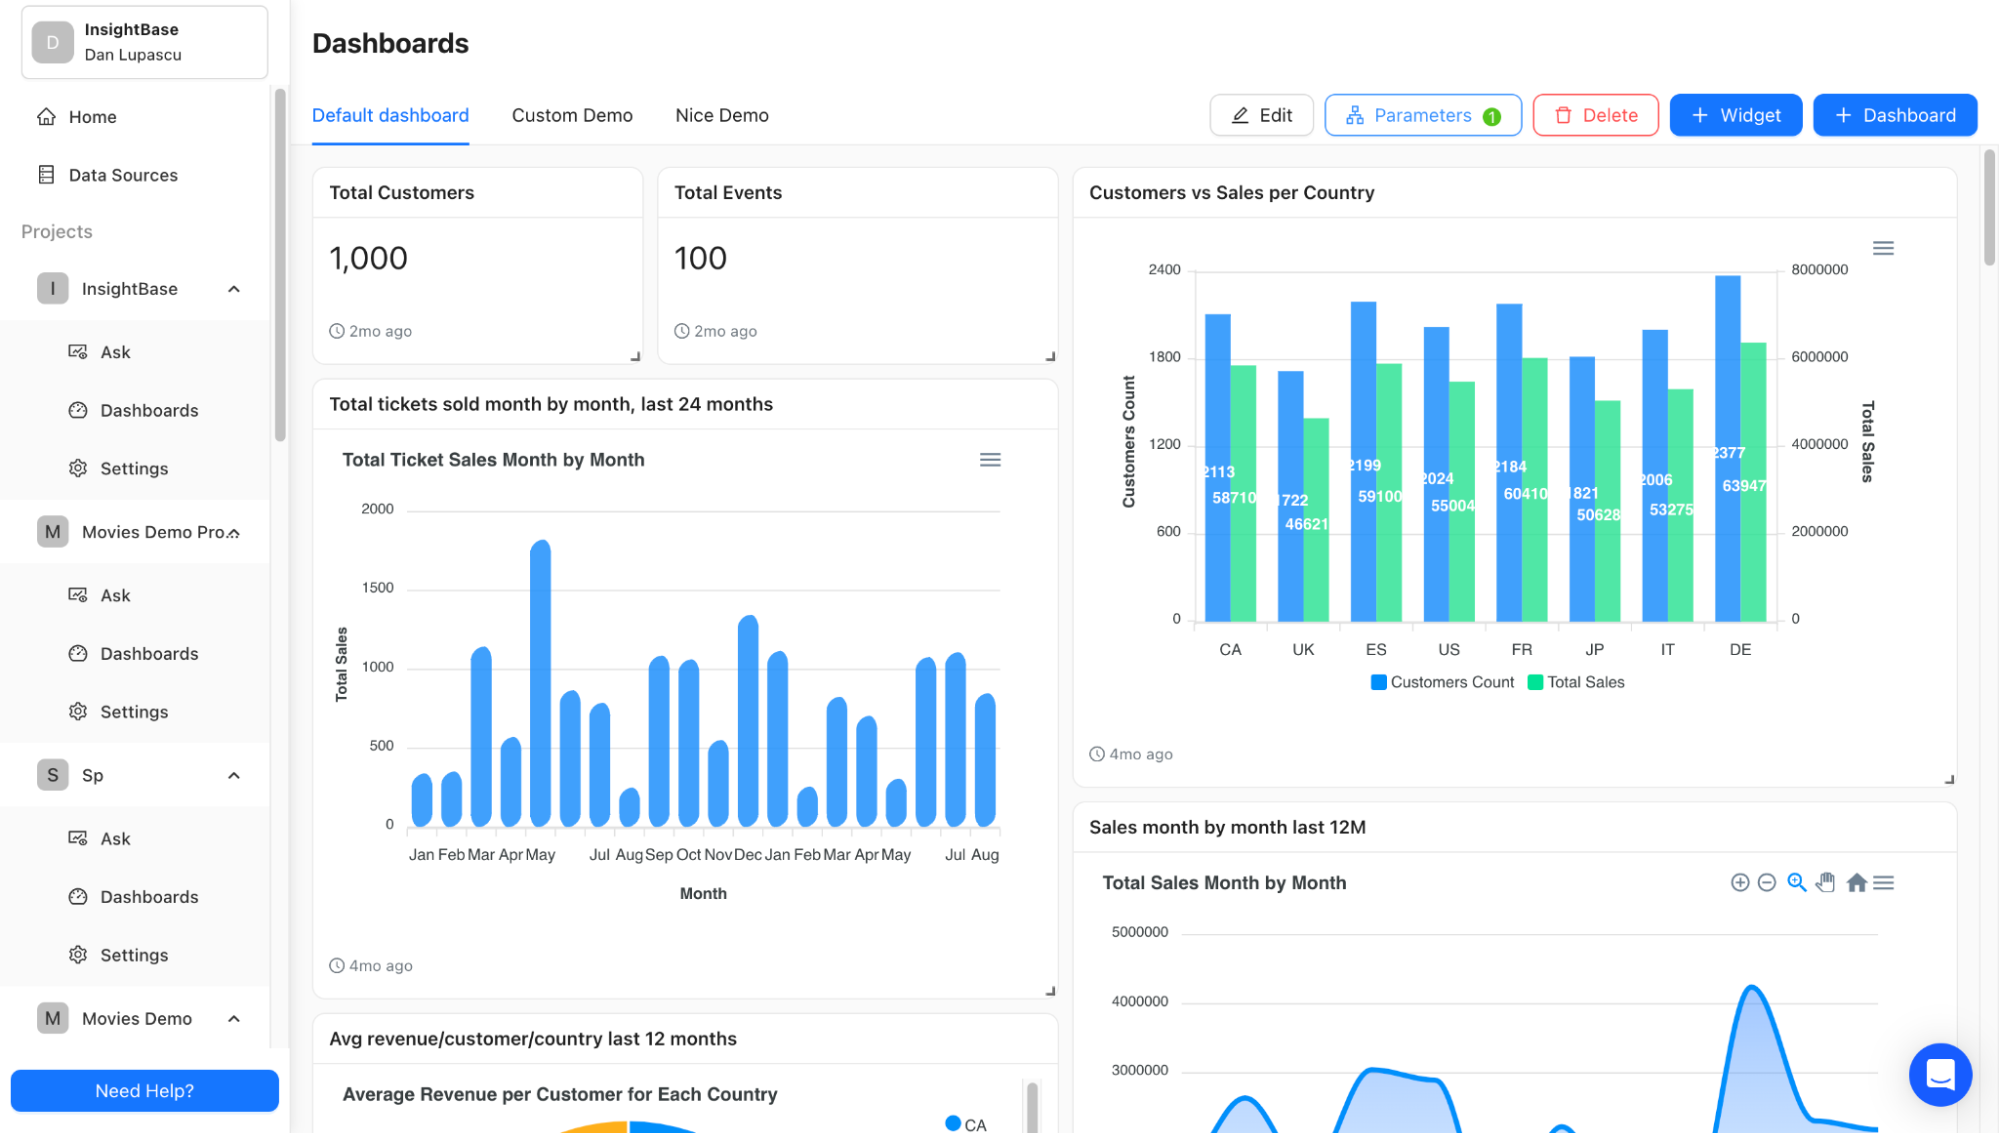
InsightBase offers customizable dashboards that allow users to visualize SQL data in various formats, including charts, graphs, and tables. These dashboards are designed to be user-friendly, making it easy for users to explore data.
3. Data Preparation
The platform includes tools for data preparation, allowing users to clean and transform SQL data before visualization. This ensures that the insights generated are accurate and reliable.
4. Real-Time Data Analysis
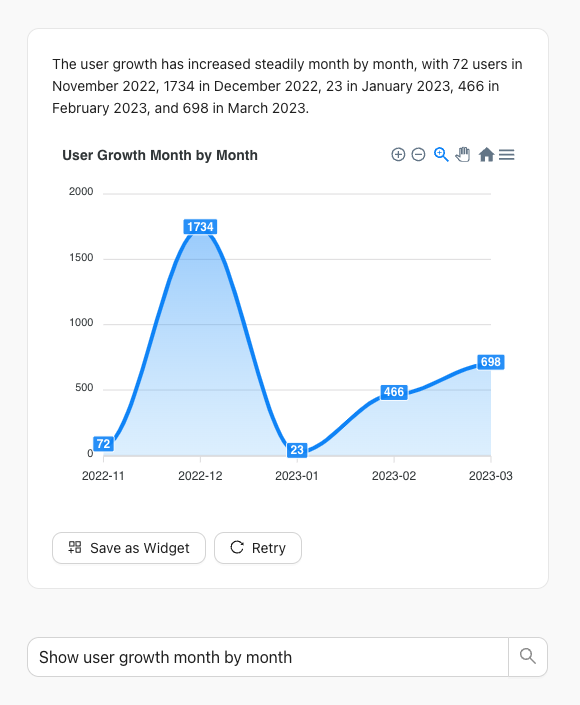
InsightBase supports real-time data analysis, ensuring that users always have access to the most up-to-date information.
5. Embedded Analytics
InsightBase supports embedded analytics, enabling businesses to integrate SQL data visualizations into their existing applications.
Pros of InsightBase
- Uses AI to enhance data analysis and visualization
- Designed for ease of use, even for non-technical users
- Provides real-time data analysis for quick insights
Cons of InsightBase
- Limited features for advanced users
- Smaller community and support options
- Can be pricey for small businesses
- Limited export and sharing options
- Requires technical support for complex setups
InsightBase Pricing
- Startup Plan: $99/month
- Business Plan: $249/month
- Enterprise Plan: Custom pricing is available
Final Verdict
InsightBase is a solid choice for small to medium-sized businesses looking to enhance their SQL data visualization capabilities. Its AI-driven analytics and user-friendly interface make it an excellent tool for gaining actionable insights from SQL data. However, users should consider the customization options and pricing when evaluating InsightBase for their specific needs.
9. Mode Analytics

Mode Analytics is a modern business intelligence platform designed to empower teams with data exploration and visualization tools. With Mode, you can explore large datasets fast using its visual explorer, which lets you drag and drop your way through charts and graphs. Whether starting with a SQL query or a pre-built dataset, Mode helps you quickly spot trends and build visualizations. It's perfect for creating quick reports, dashboards, and charts without needing to code. If you need to make sense of your data and share insights with your team, Mode makes it easy and efficient.
Key Features
1. Visual Explorer
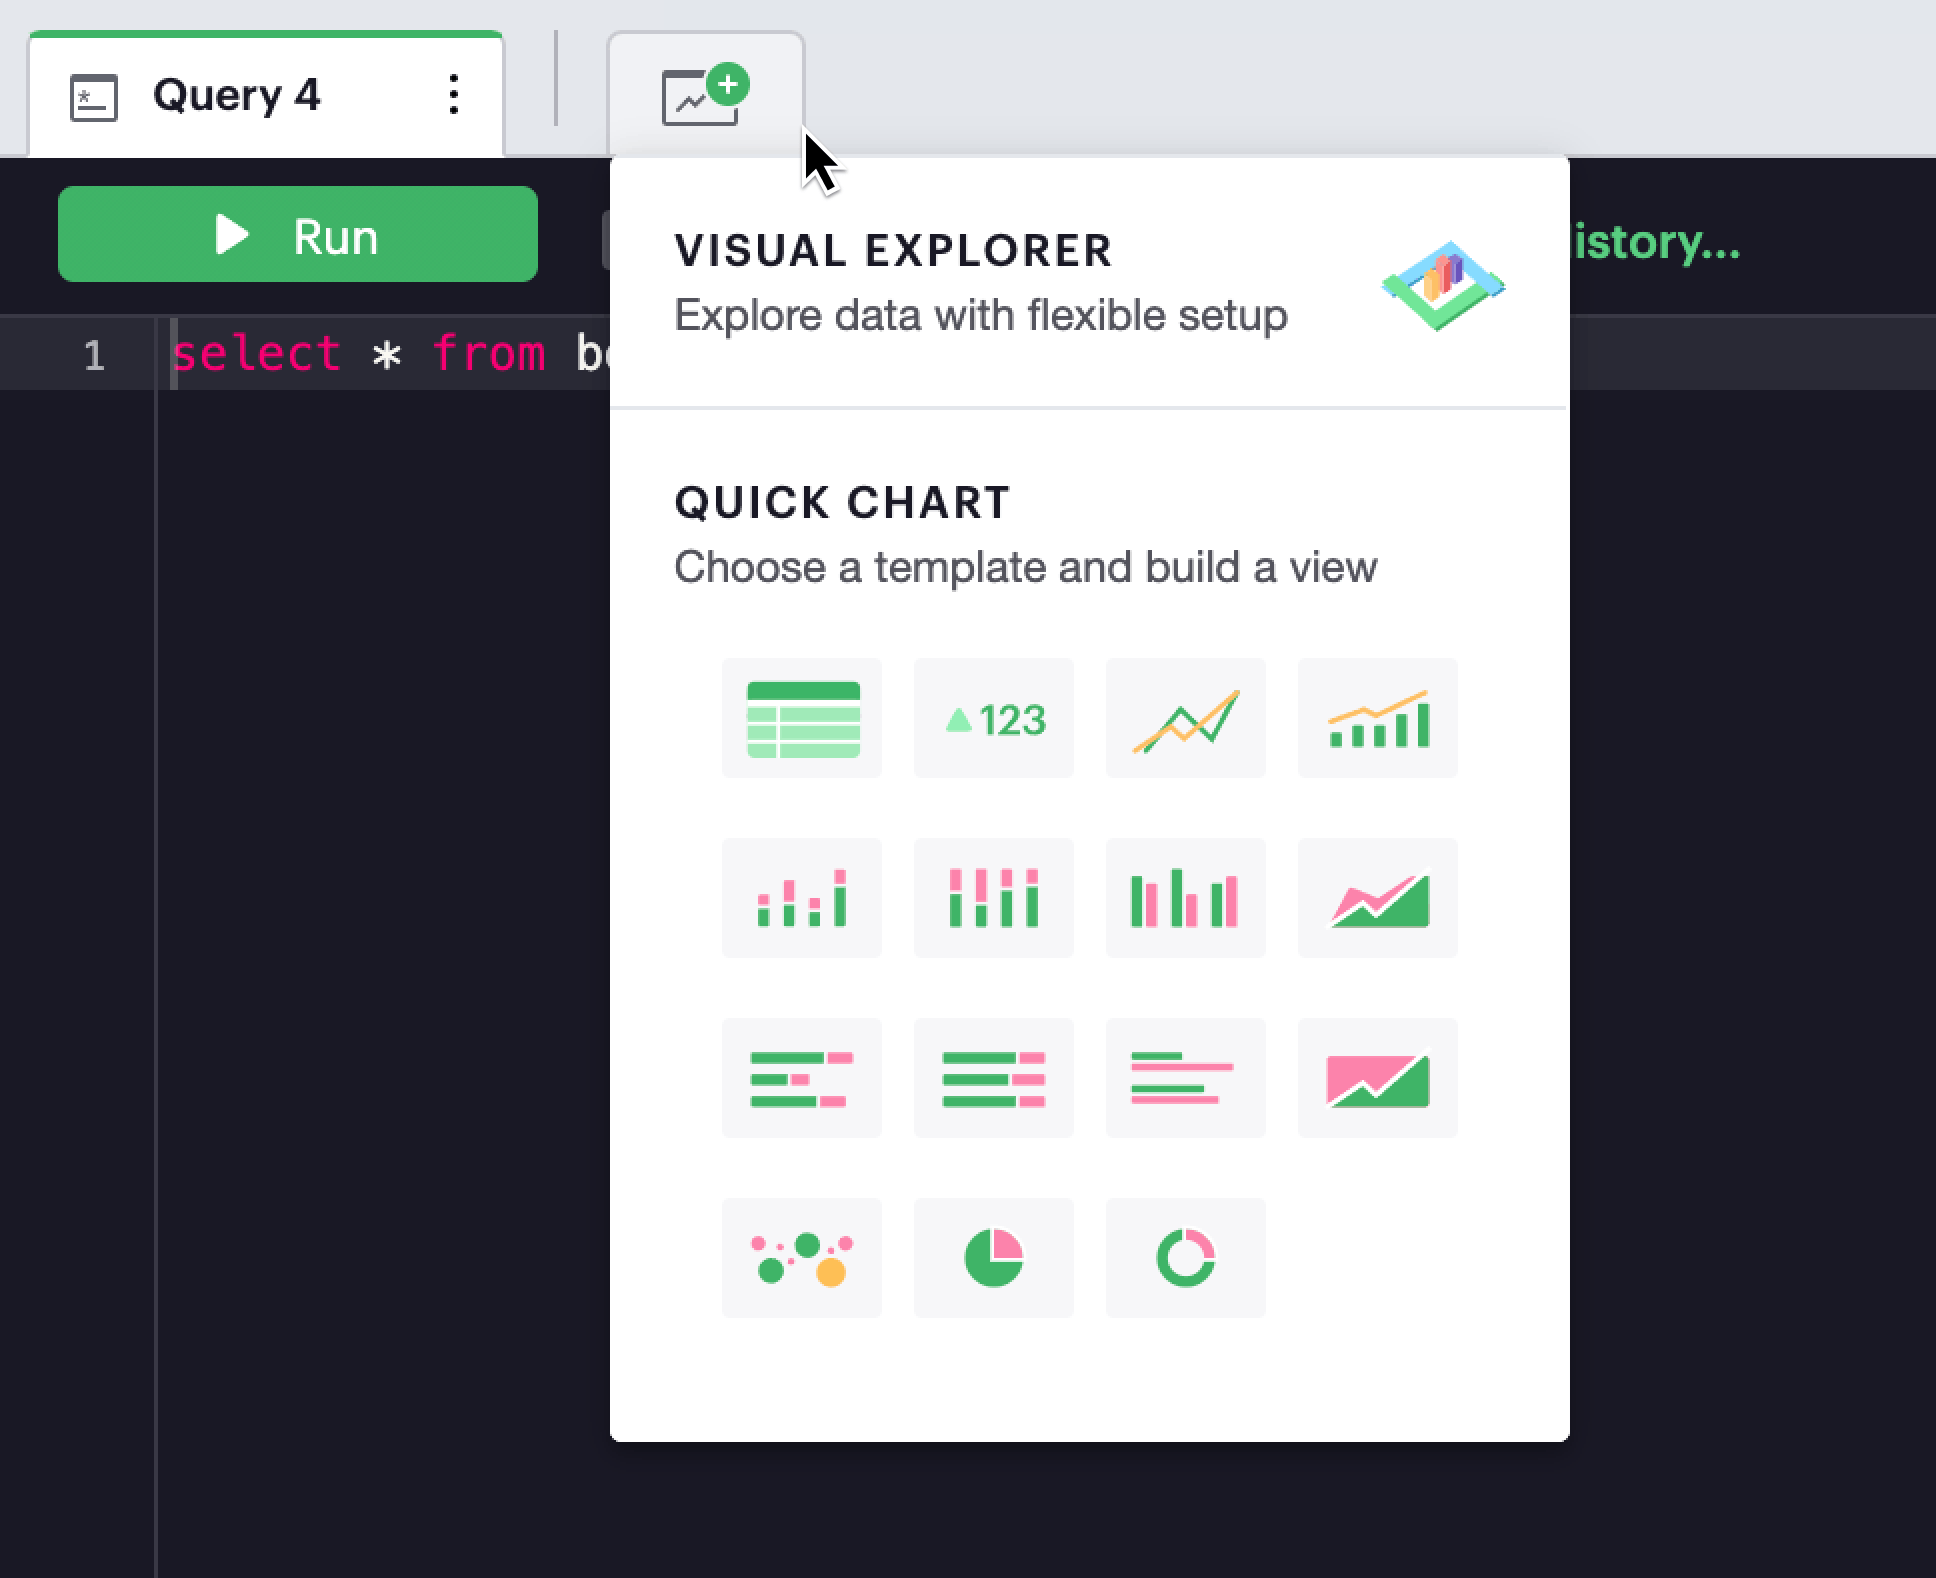
Mode’s Visual Explorer lets you quickly create and interact with visualizations from SQL query results or datasets, making data analysis simple and fast.
2. In-Memory Data Engine
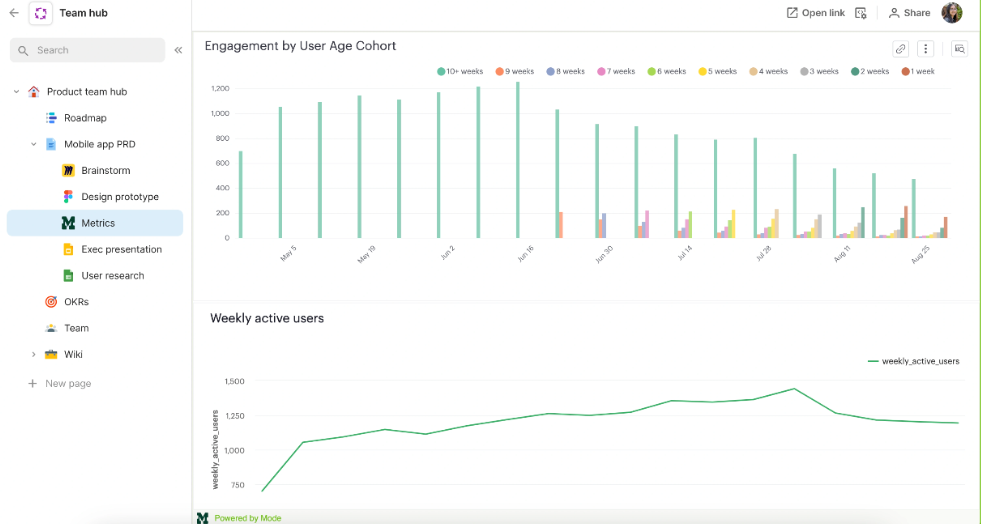
Powered by a strong in-memory engine, Mode can handle large SQL datasets, allowing for rapid iteration and exploration of different chart types.
3. Customizable Charts
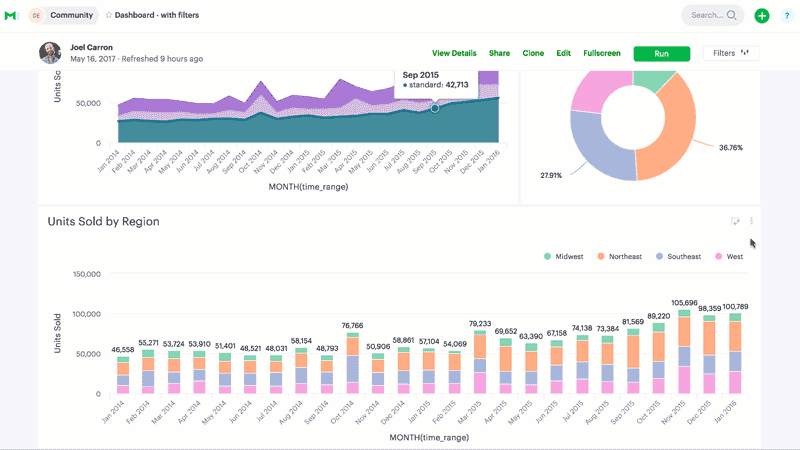
Mode enables you to change the colors and styles of individual chart elements, helping you highlight critical trends and insights from your SQL data.
4. Self-Serve Reporting
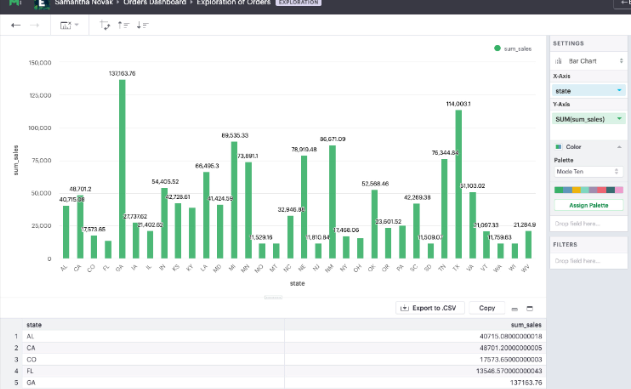
Build dashboards and reports directly from your SQL data, giving everyone in your organization easy access to the insights they need without coding.
5. Flexible Formatting
Mode offers flexible formatting options for SQL data visualizations, allowing you to create informative and visually appealing reports.
6. Embedded Analytics
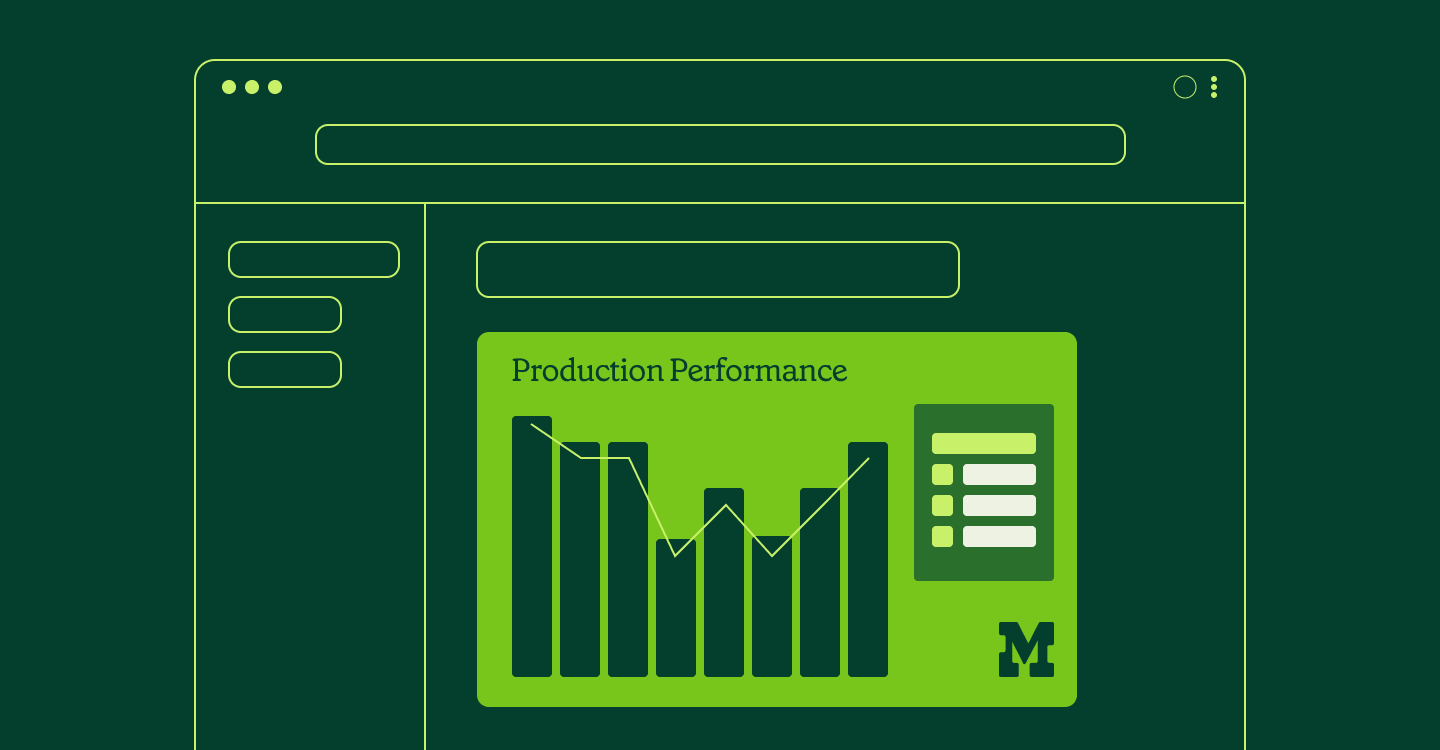
Mode Analytics supports embedded analytics, enabling businesses to integrate SQL data visualizations into their existing applications.
Pros of Mode Analytics
- Customizable visualizations and reports
- Suitable for collaborative data analysis
- Integrates well with data science tools
Cons of Mode Analytics
- Can be complex for non-technical users
- Learning curve for advanced features
- Limited data source integrations
- Performance may slow with large datasets
- Higher cost for premium features
Mode Analytics Pricing
- Pricing information is available upon request.
Final Verdict
Mode Analytics is a solid choice for anyone working with SQL data who needs fast, easy-to-use data visualization and reporting tools. Its visual explorer and in-memory data engine make it quick to analyze large datasets, while its customization options let you highlight the insights that matter most. Mode’s self-serve reporting ensures that everyone on your team can access and understand the data without coding.
10. Seek

Seek is an innovative AI-driven platform that enhances SQL data visualization and analysis. It offers a range of tools that allow users to explore, analyze, and visualize SQL data through dashboards and reports. Seek is particularly well-suited for businesses that want to use AI to gain deeper insights from their SQL databases. With its focus on increasing data effectiveness and ROI, Seek helps companies make informed decisions and stay ahead of industry trends. Whether you're in finance, healthcare, or retail, Seek transforms your data into actionable insights effortlessly.
Key Features
1. AI-Driven Data Analysis
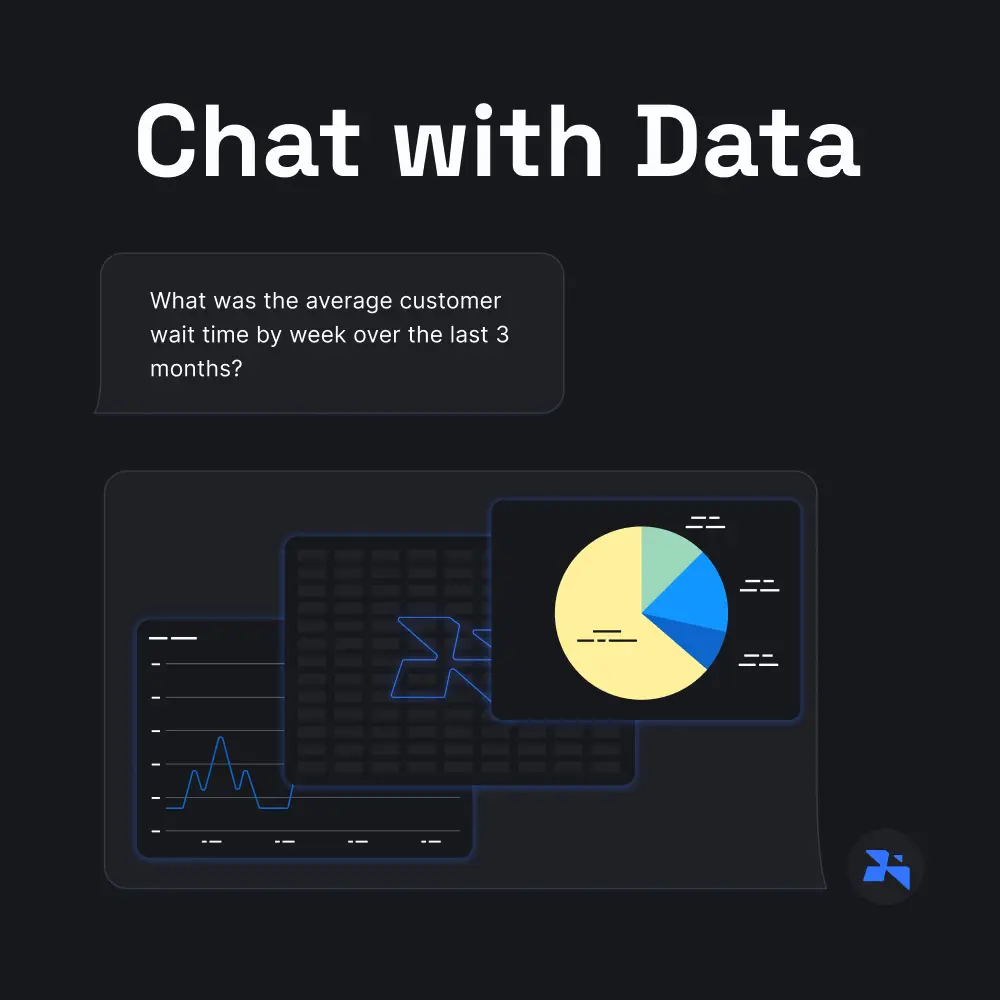
Seek uses AI to analyze SQL data, providing users with insights that might go unnoticed. This feature helps businesses make informed decisions based on accurate and timely data.
2. Interactive Dashboards
Seek offers customizable dashboards that allow users to visualize SQL data in various formats, including charts, graphs, and tables. These dashboards are designed to be user-friendly, making it easy for users to explore data.
3. Embedded AI Data Analyst
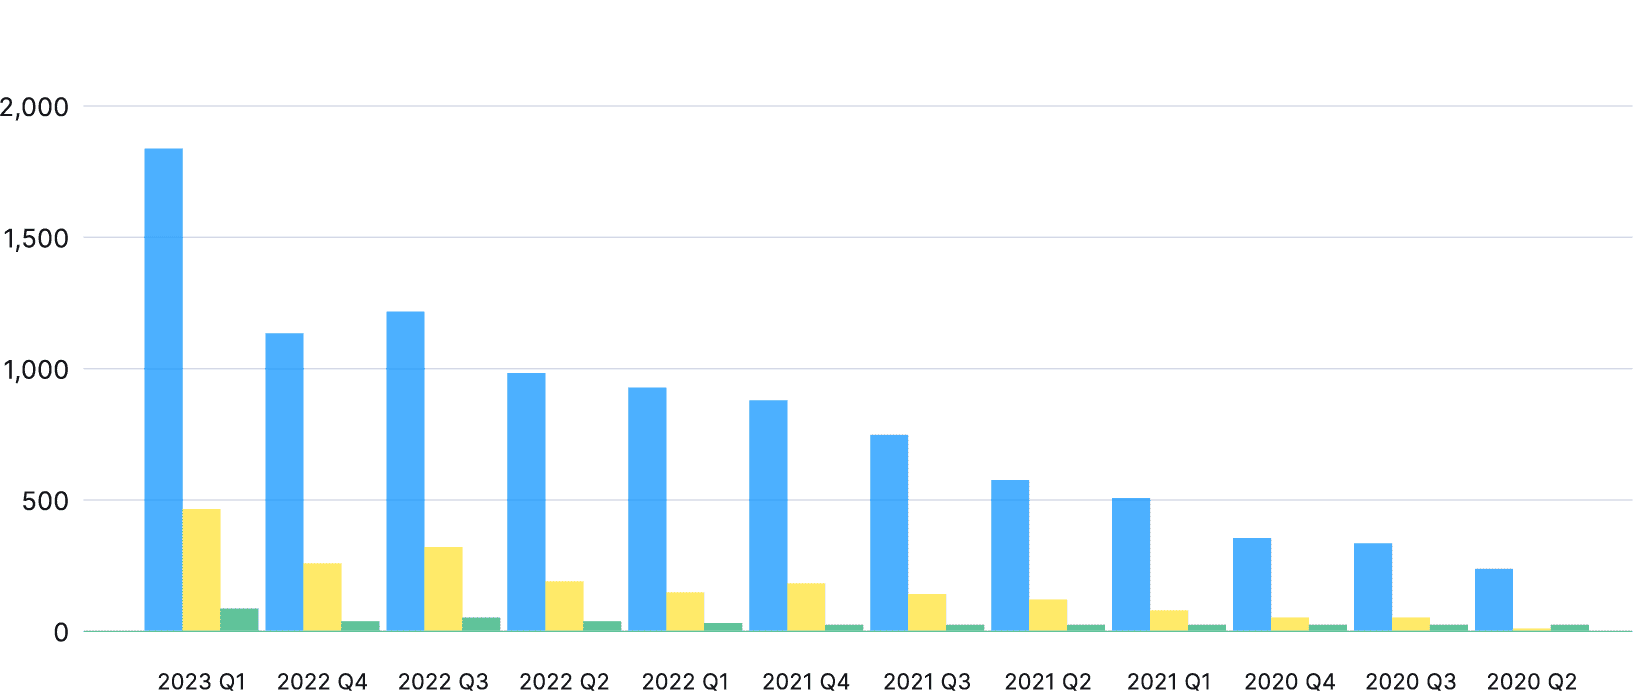
Seek’s embedded AI data analyst provides users with AI-driven insights and recommendations based on their SQL data. This feature is particularly useful for businesses that want to leverage AI for data-driven decision-making.
4. Real-Time Data Analysis
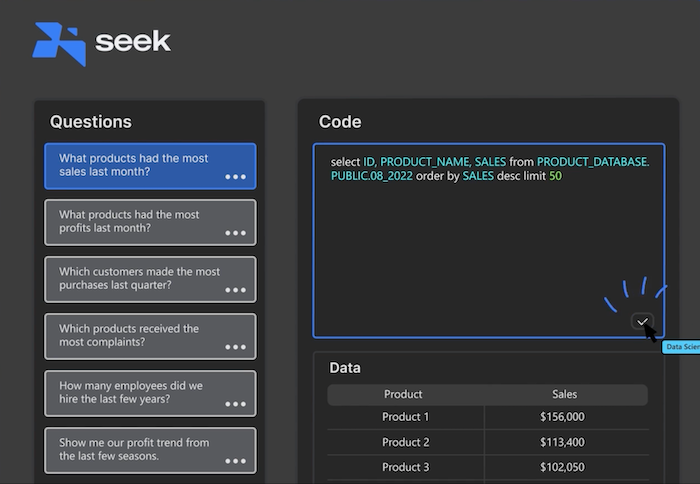
Seek supports real-time data analysis, ensuring that users always have access to the most up-to-date information.
5. Collaborative Reporting
Seek offers collaboration tools that allow teams to share insights, dashboards, and reports, facilitating better decision-making across departments.
Pros of Seek
- AI-driven SQL data querying
- Real-time insights with natural language queries
- Strong focus on data security and compliance
Cons of Seek
- Limited features for advanced data analysis
- Smaller feature set compared to competitors
- Learning curve for non-technical users
- May require technical support for setup
- Pricing can be high for small businesses
Seek Pricing
- Seek offers custom pricing plans
Final Verdict
Seek is an excellent tool for businesses using AI for SQL data visualization and analysis. Its AI-driven insights and user-friendly interface make it a top choice for organizations that require real-time data analysis and collaboration. However, users should consider the customization options and pricing when evaluating Seek for their specific needs.
Conclusion
Choosing the right SQL data visualization tool can significantly enhance your ability to analyze and present data effectively with SQL databases. Each of the top 10 tools we've discussed offers unique features that cater to different business needs. Whether you're looking for ease of use, advanced analytics, or seamless integration, a tool on this list can meet your requirements.
While all the tools have their strengths, BlazeSQL stands out as the number 1 choice for SQL data visualization. These tools offer a combination of user-friendliness, advanced features, and analytics capabilities, making them the best options for businesses looking to get the most out of their SQL data.


